Login
WATCH FREE
Welcome to RaceiQ
RaceiQ is the new platform designed to provide in-depth analysis on each runner and their performance throughout the race. Previously, many mid race incidents would only be obvious to a keen racing eye, however our new suite of metrics are designed to open up the narrative of a race to everyone, regardless of their racing experience and knowledge.

RaceiQ on racingtv.com
RaceiQ’s suite of metrics and underlying data is now freely available to users on racingtv.com and the Racing TV mobile app. Users will now be able to access this data for free on the new and improved Results pages of the Racing TV website and app.
The data will be available minutes after the end of every British and Irish race, and it has been backdated to March 2023 for British races and January 2024 for Irish races. Sectionals data has also been fully integrated, with unique datapoints and display features for every horse - and every furlong - of every British and Irish race.
To find out more about our new Results pages, follow the links below:
Raceiq Explainer
Follow RaceiQ
You can follow our RaceiQ data insights:
RaceiQ Metrics
● Finishing speed percentage (FSP) reflects how fast a horse covers the final furlongs compared to the full race: e.g. 102% means the average time of the final furlongs (Flat: final two furlongs up to 1m110yds, final three furlongs for further, Jumps: final four furlongs) was 2% quicker than the race as a whole.
● Time Index scores a race out of 10 indicating how a race time has performed compared to ‘Par’.
● Par Time is the expected win of a race based on the track, distance, going, race class and conditions.
● Par Sectionals contextualise a horse’s sectionals against the ‘optimal sectionals’ for a specific track and distance.
● Par FSP contextualises a horse’s FSP against the ‘optimal’ for a specific track and distance.
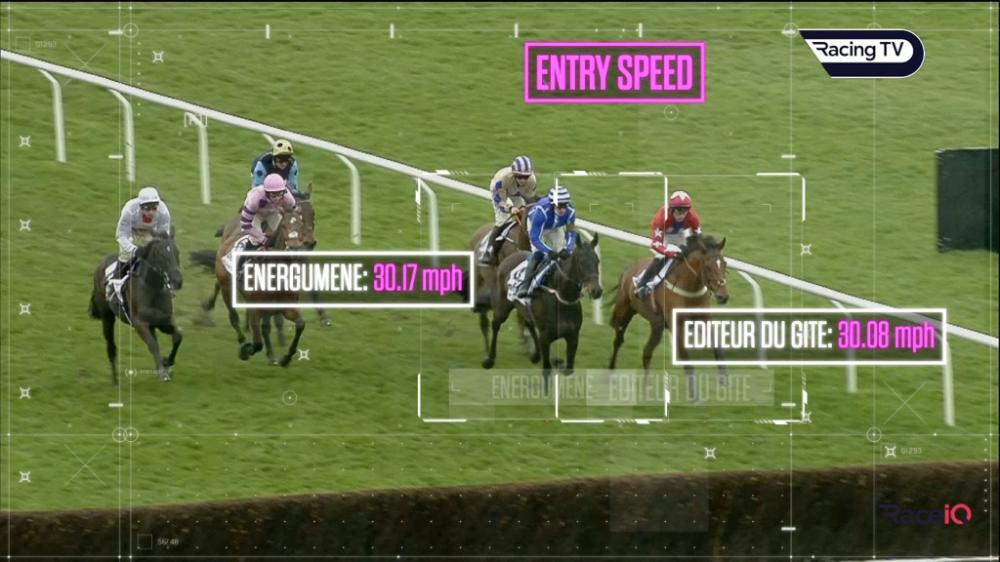
● 0-20mph measures the number of seconds a runner took to reach 20mph at the start.
● Lengths Gained Jumping (LGJ) measures the number of lengths gained (or lost) at each obstacle in a race. Measured against the median of the field.
● Jump Index assesses a horse’s jumping in its own right and without reference to the competition. The index produces a score out of ten reflecting how well the horse jumped at an obstacle or in a race.

RaceiQ Explainers
Click on the links below to find out more about some of our metrics:
Our Aims
Over the coming months we will be continuing to develop exciting new ways of viewing races with the aim of:
● Deepening every fan’s understanding: Traditionally as broadcasters, we have only been able to analyse races through the interpretation of our presenters and pundits. Now we will be able to give them facts to show you exactly why certain things happen within a race.
● Offer compelling new narratives: By watching racing using these exciting new tools we can highlight where a race was won or lost and open up comparisons between horses like never before.
● Highlighting the key to each race: As we continuously develop our platform we will be able to cover all aspects of horse racing, showing the right data for a specific race at the right time.
For information about how RaceiQ can support your business, please visit https://raceiq.com/
Copyright 2026 Racing TV - All Rights Reserved.
Please bet responsibly
Copyright 2026. All rights reserved