Login
WATCH FREE
RaceiQ on racingtv.com: RaceiQ Comparison Tab Information
RaceiQ data is now available on racingtv.com and the Racing TV mobile app for all British and Irish races. Data for races will be available minutes after the race has finished, with historic data backdated to March 2023 for British races, and January 2024 for Irish races. This page will provide information on our new RaceiQ Comparison tab, and on the metrics that are shown within it.
What the new RaceiQ Comparison tab shows
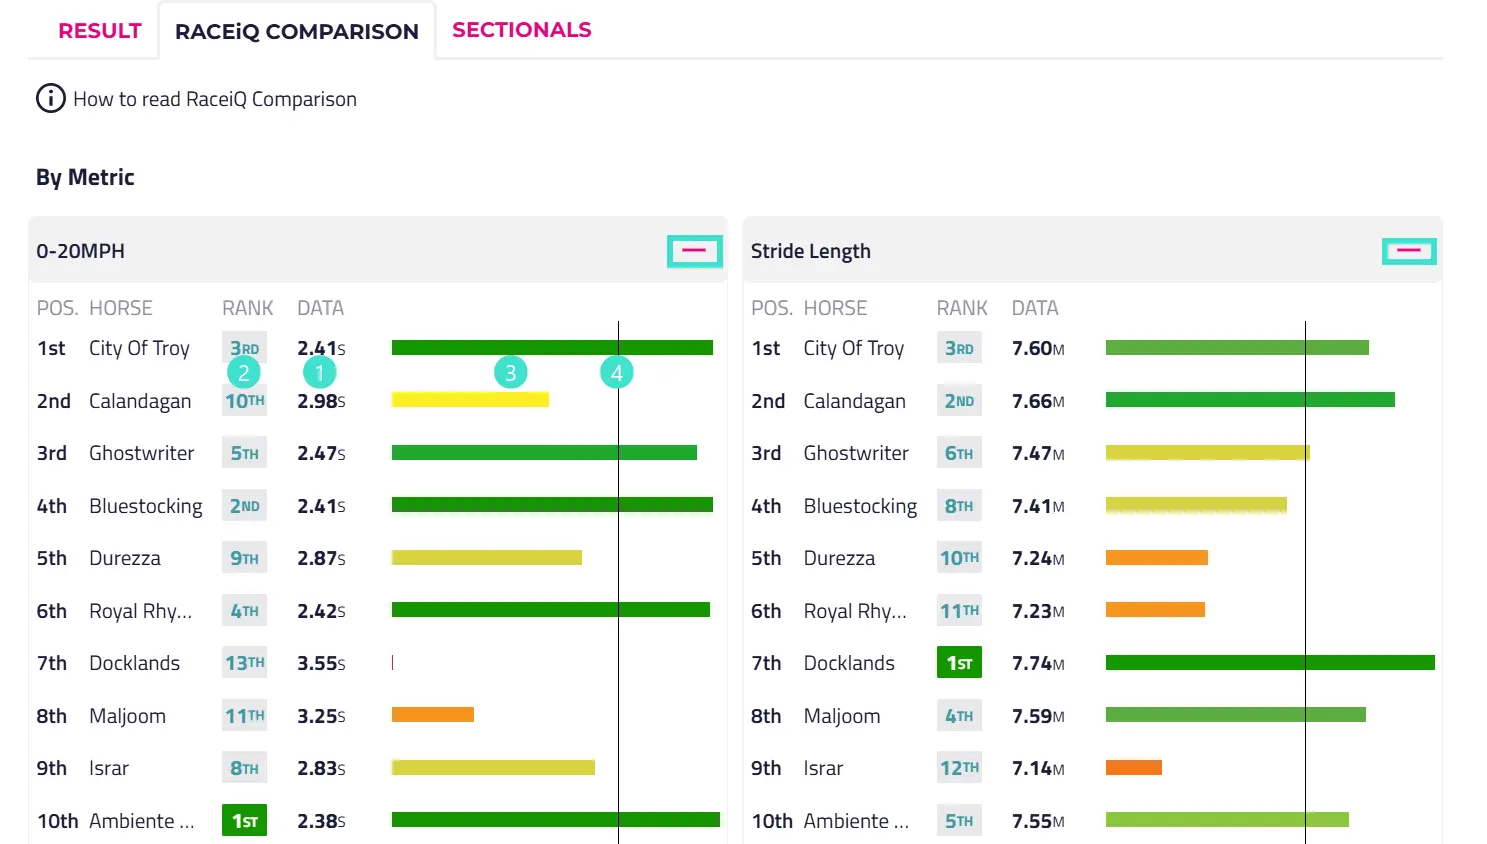
The Comparison tab allows users to easily analyse the result of a race through the prism of any of the core RaceiQ Race metrics. For example, if you are interested in seeing how a horse’s Lengths Gained Jumping value compared to its rivals, you can use this tab to quickly access and compare this information. Click the "+" button to open the information for a metric, and the "-" button to close it. Horses are shown in finishing order for consistency, with the following information displayed:
1.
Raw output
The raw data for a horse.
2.
Rank
The rank a horse achieved for the metric compared to the other horses in the race.
3.
Performance Bar
A visual representation of how a horse compared to the best and worst performers in the race for the metric. If a horse was the top performer in the race for the metric, it would have a full green bar. If it was the worst performer in the race for the metric, its bar would have only a red slither. If the highest Top Speed in a race was 36.00mph, the lowest was 34.00mph, and a horse achieved a Top Speed of 35.00mph, the Performance Bar for that horse would be exactly half full.
4.
Race average
The black line within the bar denotes the median performance of the horses in the race, which highlights to users how far ahead/behind the median a horse was for the metric.
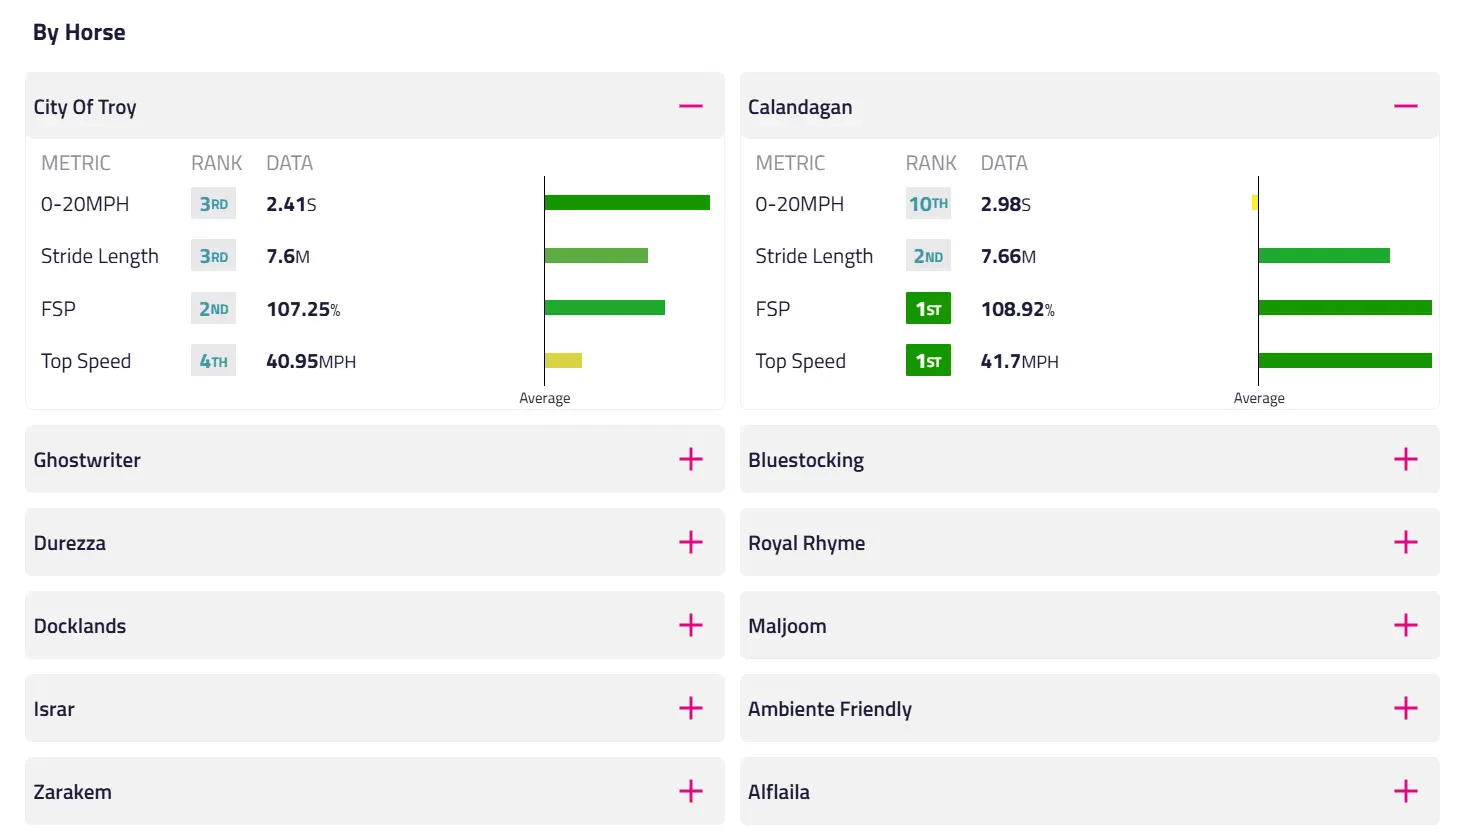
The “By Horse” section provides users with an alternative view of a horse’s performance across the Race Metrics. In this display, the Performance Bars are centred to the race median – this means a bar showing to the right of the median line represents a better than average performance on a metric, whilst a bar to the left represents a poorer than average performance on a metric.
RaceiQ data explained
Detailed below is a definition of each RaceiQ datapoint that you will find on our RaceiQ Comparison tab:
Race Metrics
•
Assesses a horse’s jumping against every jump in our database. The index produces a score out of ten reflecting how well the horse jumped in a race. (Jumps races only).
•
The lengths gained by a horse in a race, measured against the race median (middle performer) at each obstacle. A negative value indicates the horse lost lengths. (Jumps races only).
•
0-20MPH
The number of seconds a runner took to reach a speed of 20 miles per hour at the start of the race. (Flat races only).
•
Stride Length
The average length (in metres) of a horse’s stride throughout the race. This is measured as the full cycle of a stride, e.g. the moment a horse’s back legs hit the ground, to the next time they hit the ground. (Flat races only).
•
Top Speed
The fastest speed (in MPH) that the horse reached in the race. (All races).
•
The average sectional time in the final furlongs as a percentage of the average sectional time over the full race. For example: a race with an FSP of 102% means the average sectional time of the final furlongs was 2% quicker than average sectional time of the full race. (All races).
Jumping Data Averages
•
Entry Speed
The speed (in MPH) a horse was running at when it entered the Jumping Envelope (30 metres before the obstacle), averaged across each jump in the race.
•
The difference in a horse’s speed (in MPH) from entering the Jumping Envelope to landing after jumping the obstacle, averaged across each jump in the race.
RaceiQ on racingtv.com
Alongside our Comparison tab, we also have RaceiQ data on our Result tab and Sectionals tab, as well as the data regularly featuring in our editorial and tipping content. Follow the links below to find out more:
For information about how RaceiQ can support your business, please visit https://raceiq.com/
Copyright 2026 Racing TV - All Rights Reserved.
Please bet responsibly
Copyright 2026. All rights reserved