Login
WATCH FREE
Introducing the RaceiQ Par Time and Time Index
One of the most powerful tools for sporting race analysis is timing data. Across many sports it powers insights comparing performances to World Records, European Records, Olympic Records, and even personal records. The biggest difference for us in horse racing is the number of variables is so much higher. Whilst some athletics tracks may perform marginally differently, they are all fairly similar in surface and formation. The same cannot be said for our beloved racecourses both sides of the Irish Sea, so what can we do to help?
By studying historical race times from the last 10 years, our data scientists have built a model that has learnt to assess race times based on previous performances. By isolating patterns across different courses, distances, classes of race and going descriptions this model will predict the average, or expected, race time for each race.
This is what we call our ‘Par Time’.
By establishing this, we can quickly have a guide about whether the time of a race is quicker or slower than we would expect to see. Let's have a look at the Derby day at Epsom as an example: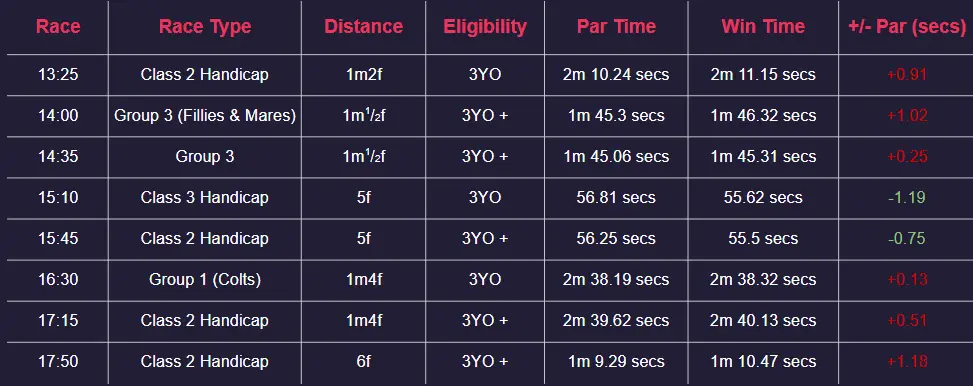
As you can see here, our model has considered the conditions for each race and, despite there being races run over the same distances, it has produced different time predictions for each of them. As you can see, most of the races came in fractionally slower than Par, but on the whole performed as we were expecting.
One thing to note is, despite us taking the main variables into consideration for our model (course, distance, class and going), there are certain factors on the day that we cannot account for. These factors may affect a horse’s ability to achieve the Par Time, or give it a helping hand. This is where it becomes interesting for you to make your own judgement.
For example; the ground may be riding slower than officially described, the pace of the race slower than optimal, or the horses could have been running into a head wind. These are factors that in time we may be able to factor in, but until then, we hope it gives you some space to pass your own judgement about why a horse hasn’t run the race in a ‘Par Time’. Maybe it’s just not very good!
Speaking of which, how do we take this a step further and use this Par Time to compare a race time against the historical data the model has been learning from? As we know, some tracks will have a bigger spread of race times, so what does a second quicker than Par actually mean? A second quicker than Par at the Curragh could mean something very different to a second quicker than Par at Kempton. Or even just at Kempton, what does a second mean over five furlongs compared to two miles?
This is where we can introduce our Time Index:
The RaceiQ Time Index is calculated by projecting a distribution of expected winning times for a race. We can see where a race's win time falls in this distribution of expected winning times and attribute a score (out of 10) to illustrate by how much a race has over or underperformed compared to what we were expecting. A race run close to our Par Time would score around a 5 or 6.
Let's head back to Epsom for Derby Day and use our Time Index to assess how the races performed throughout the day: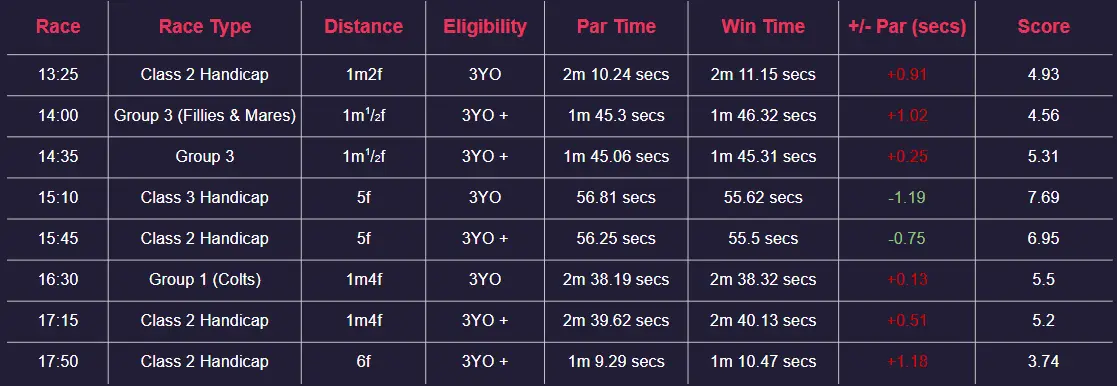
As you can see, the scores give us a better idea about what the variances from Par really mean. Take City Of Troy as an example, his time is fractionally slower than Par in the Derby, but the score of 5.5 tells us that it was very much as we expected for the race. It wasn’t a spectacular winning time, but still a very solid one.
As I mentioned earlier, there may be factors we can’t account for that will cause all of the races on a day to perform either above or below Par. Therefore we also provide a daily average alongside our Time Indexes to provide further clarity about what to expect from the races on the day:
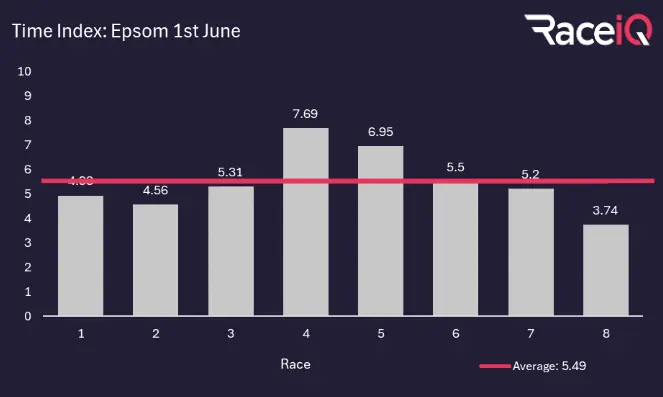
By comparing the races on the day you can see they generally performed as expected. The three year old dash (3rd Race) performed the best on the clock and the 6f handicap, the last race, the worst.
An example of a race day that didn’t perform as the model expected was the Craven day at Newmarket in April. As you may remember, the ground was given as good, however drying conditions meant that it reportedly rode more like Good to Firm going. On top of that, there was a tail wind directly behind the runners that averaged 12mph throughout the day. This meant that some very quick race times were being posted, including in the Craven. In fact, Haatem managed to record the quickest time that a Craven has ever been run in.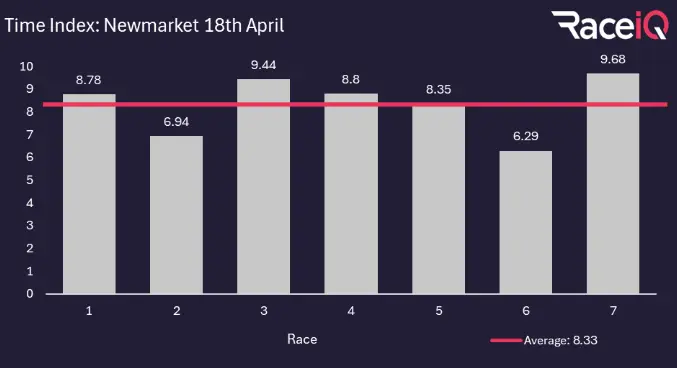
As you can see, due to these variables that this iteration of our model does not currently factor in, it underestimated how fast it expected the races to be run. This is where we lean on the daily average and the comparison across races to assess how good the times were and your own interpretation of the data will come into its own.
Copyright 2026 Racing TV - All Rights Reserved.
Please bet responsibly
Copyright 2026. All rights reserved