Login
WATCH FREE
The 2024 Randox Grand National: what the RaceiQ data tells us
By Page Fuller
Last Updated: Thu 6 Jun 2024
RaceIQ's chief data analyst and former jockey PAGE FULLER crunches all the data and reveals what the science tells us about this year's leading contenders and much more
Those trying to identify the Randox Grand National winner – whether they be hardened racing fans or once-a-year-punters – have a new weapon for this year in the RaceiQ data.
It enables us to look at the great race from a different angle via various aspects of jumping data and other metrics that have not previously been available.
First off, I will touch on the first three in the ante-post betting via what RaceiQ tells us about them. And then I will dive into the top performing horses within the main RaceiQ metrics.
Will it help us unlock the answer as to who will win? We won’t know that until shortly after 4pm on Saturday week (April 13). But here’s what the data tells us.
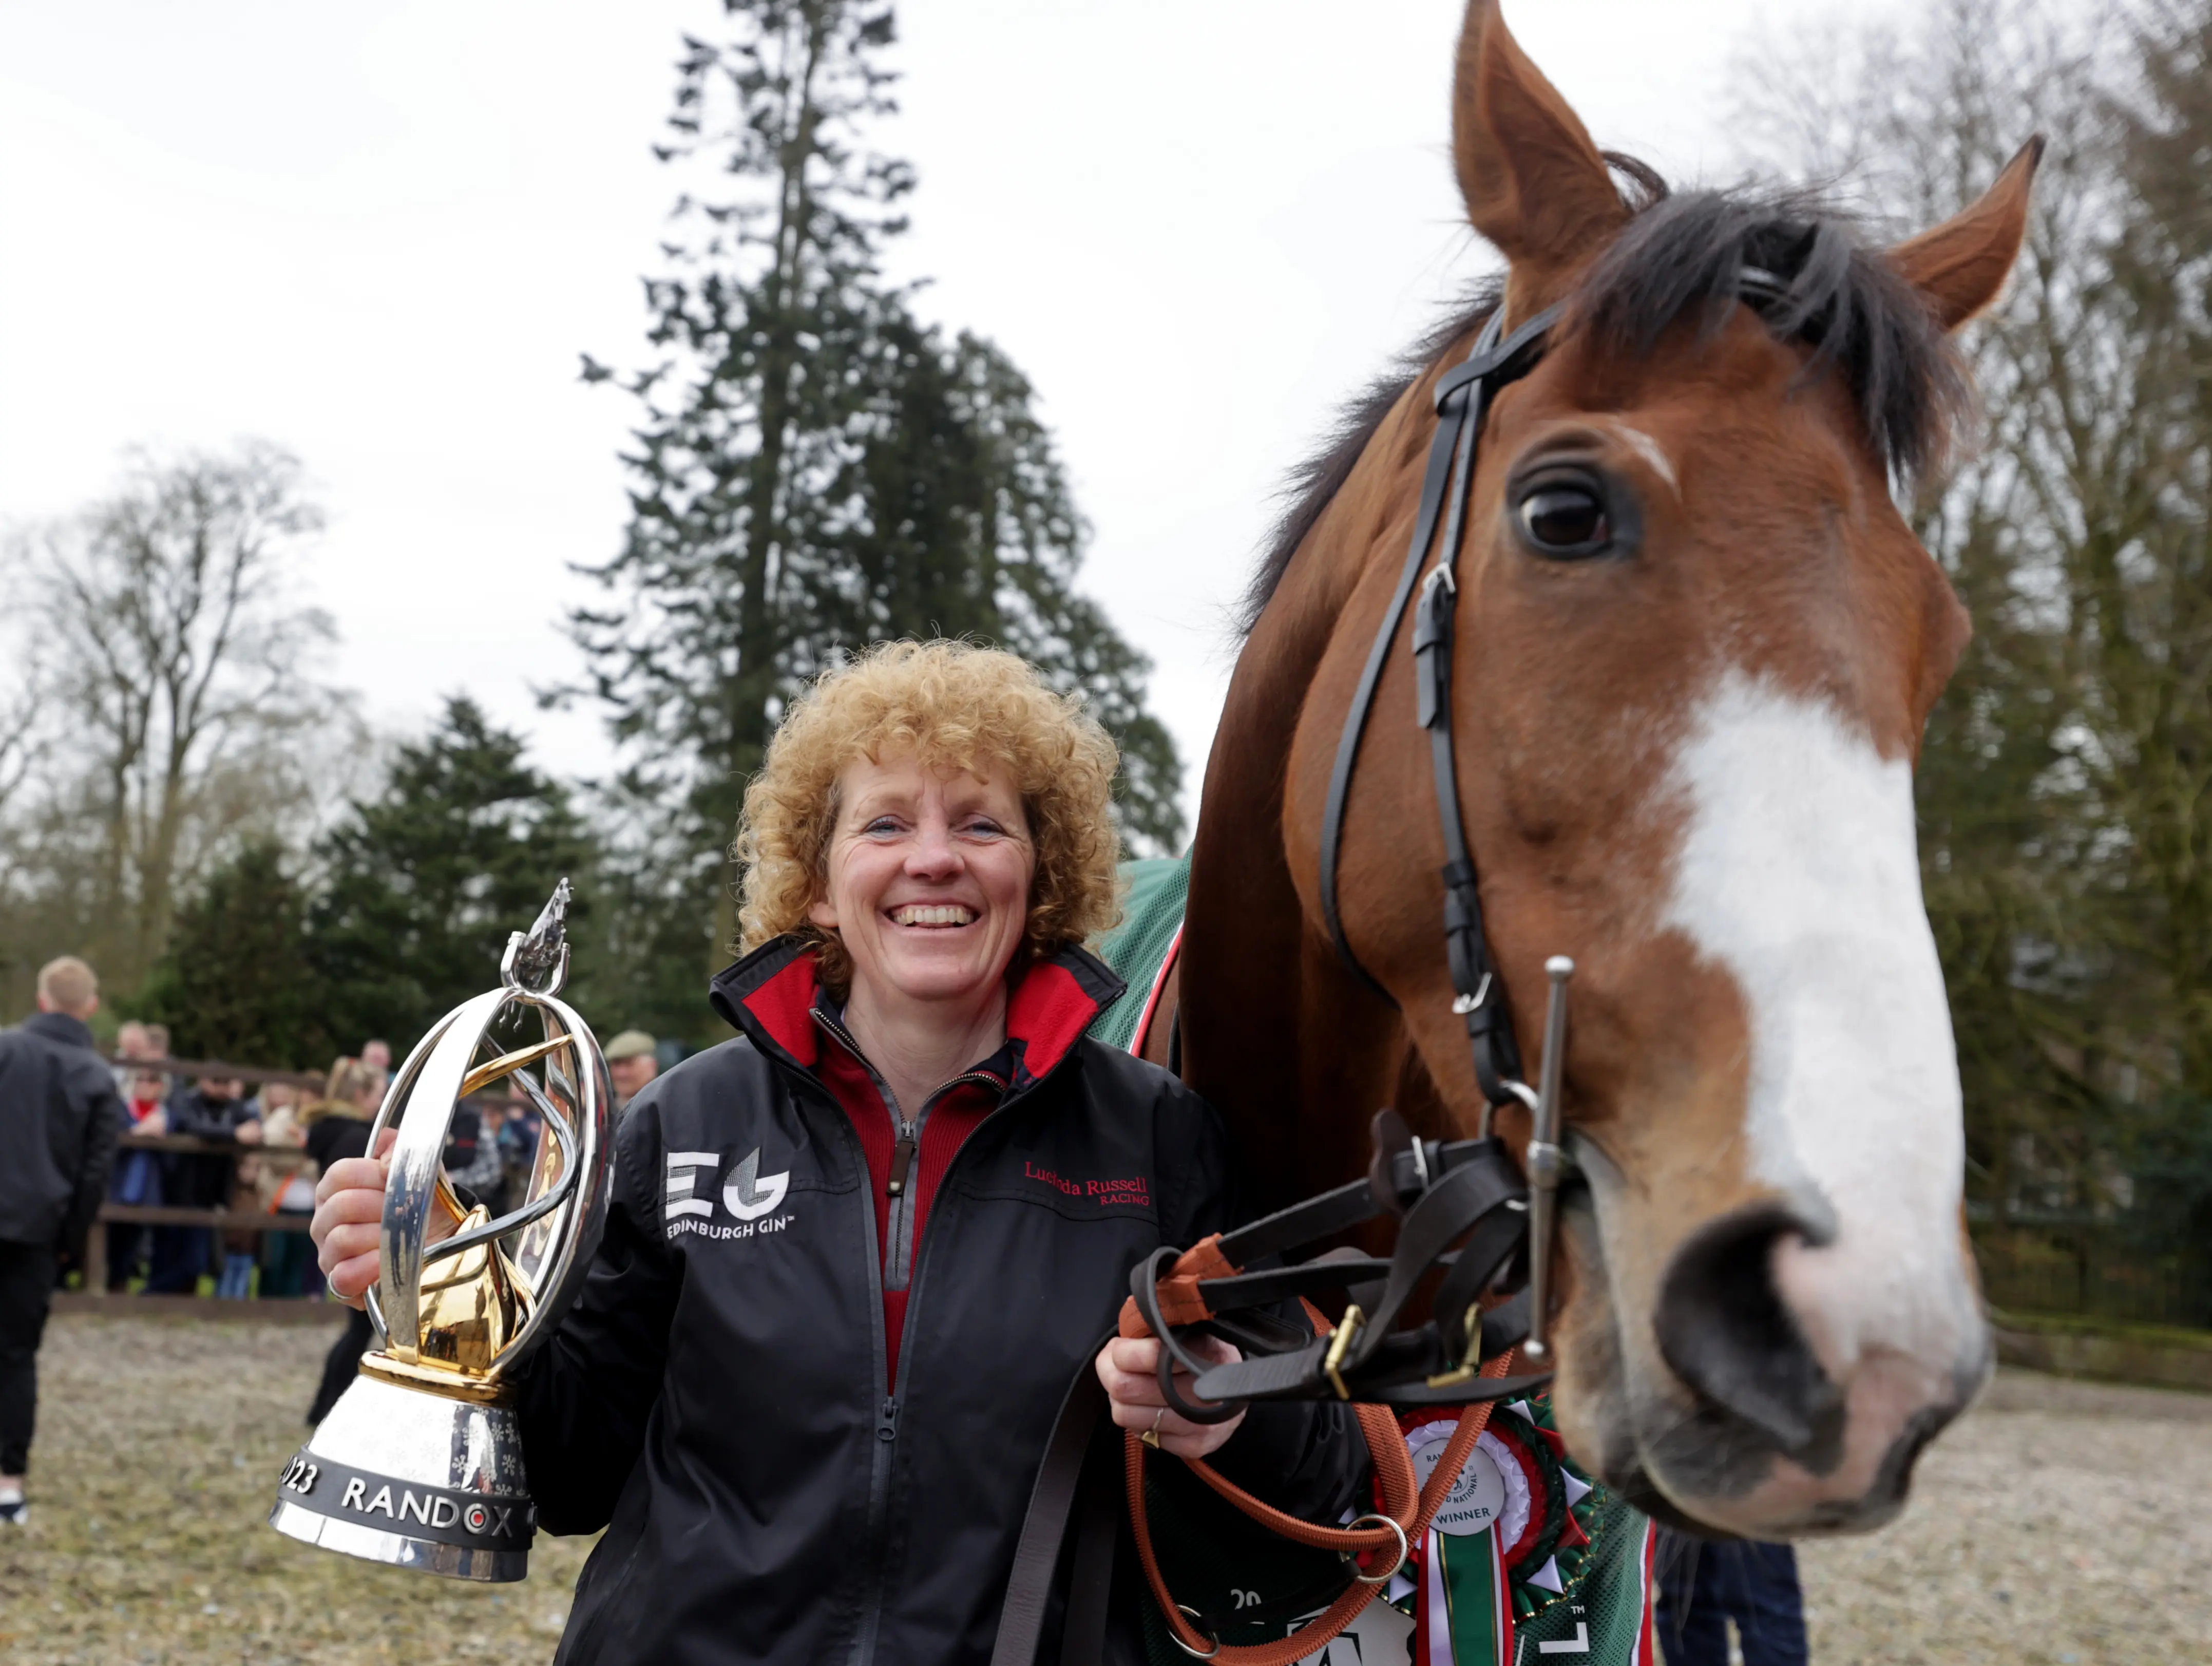
Trainer Lucinda Russell with National hero Corach Rambler
Corach Rambler: a horse tailor-made for Aintree
Last year's emphatic winner is favourite to win the National for the second successive year. He warmed up for his defence by finishing an excellent third in this month’s Cheltenham Gold Cup, showing us he’s the one to beat again.
Through our “Lengths Gained Jumping” metric it has quickly become clear why he took the National fences in his stride last year. It confirms that he is a very good jumper.
One thing we have learnt is that in small fields, especially at the top level, it usually becomes very difficult for a horse to gain an overall advantage in the jumping department.
However, Corach Rambler managed to gain seven lengths through his jumping in the Betfair Chase at Haydock in November even though he finished a well beaten third.
He also gained over seven lengths through his jumping in the Gold Cup - again by far the best in the field - which is very creditable given the level of opposition.
One thing you can count on with Corach Rambler is that he will again relish this jumping test that Aintree provides.
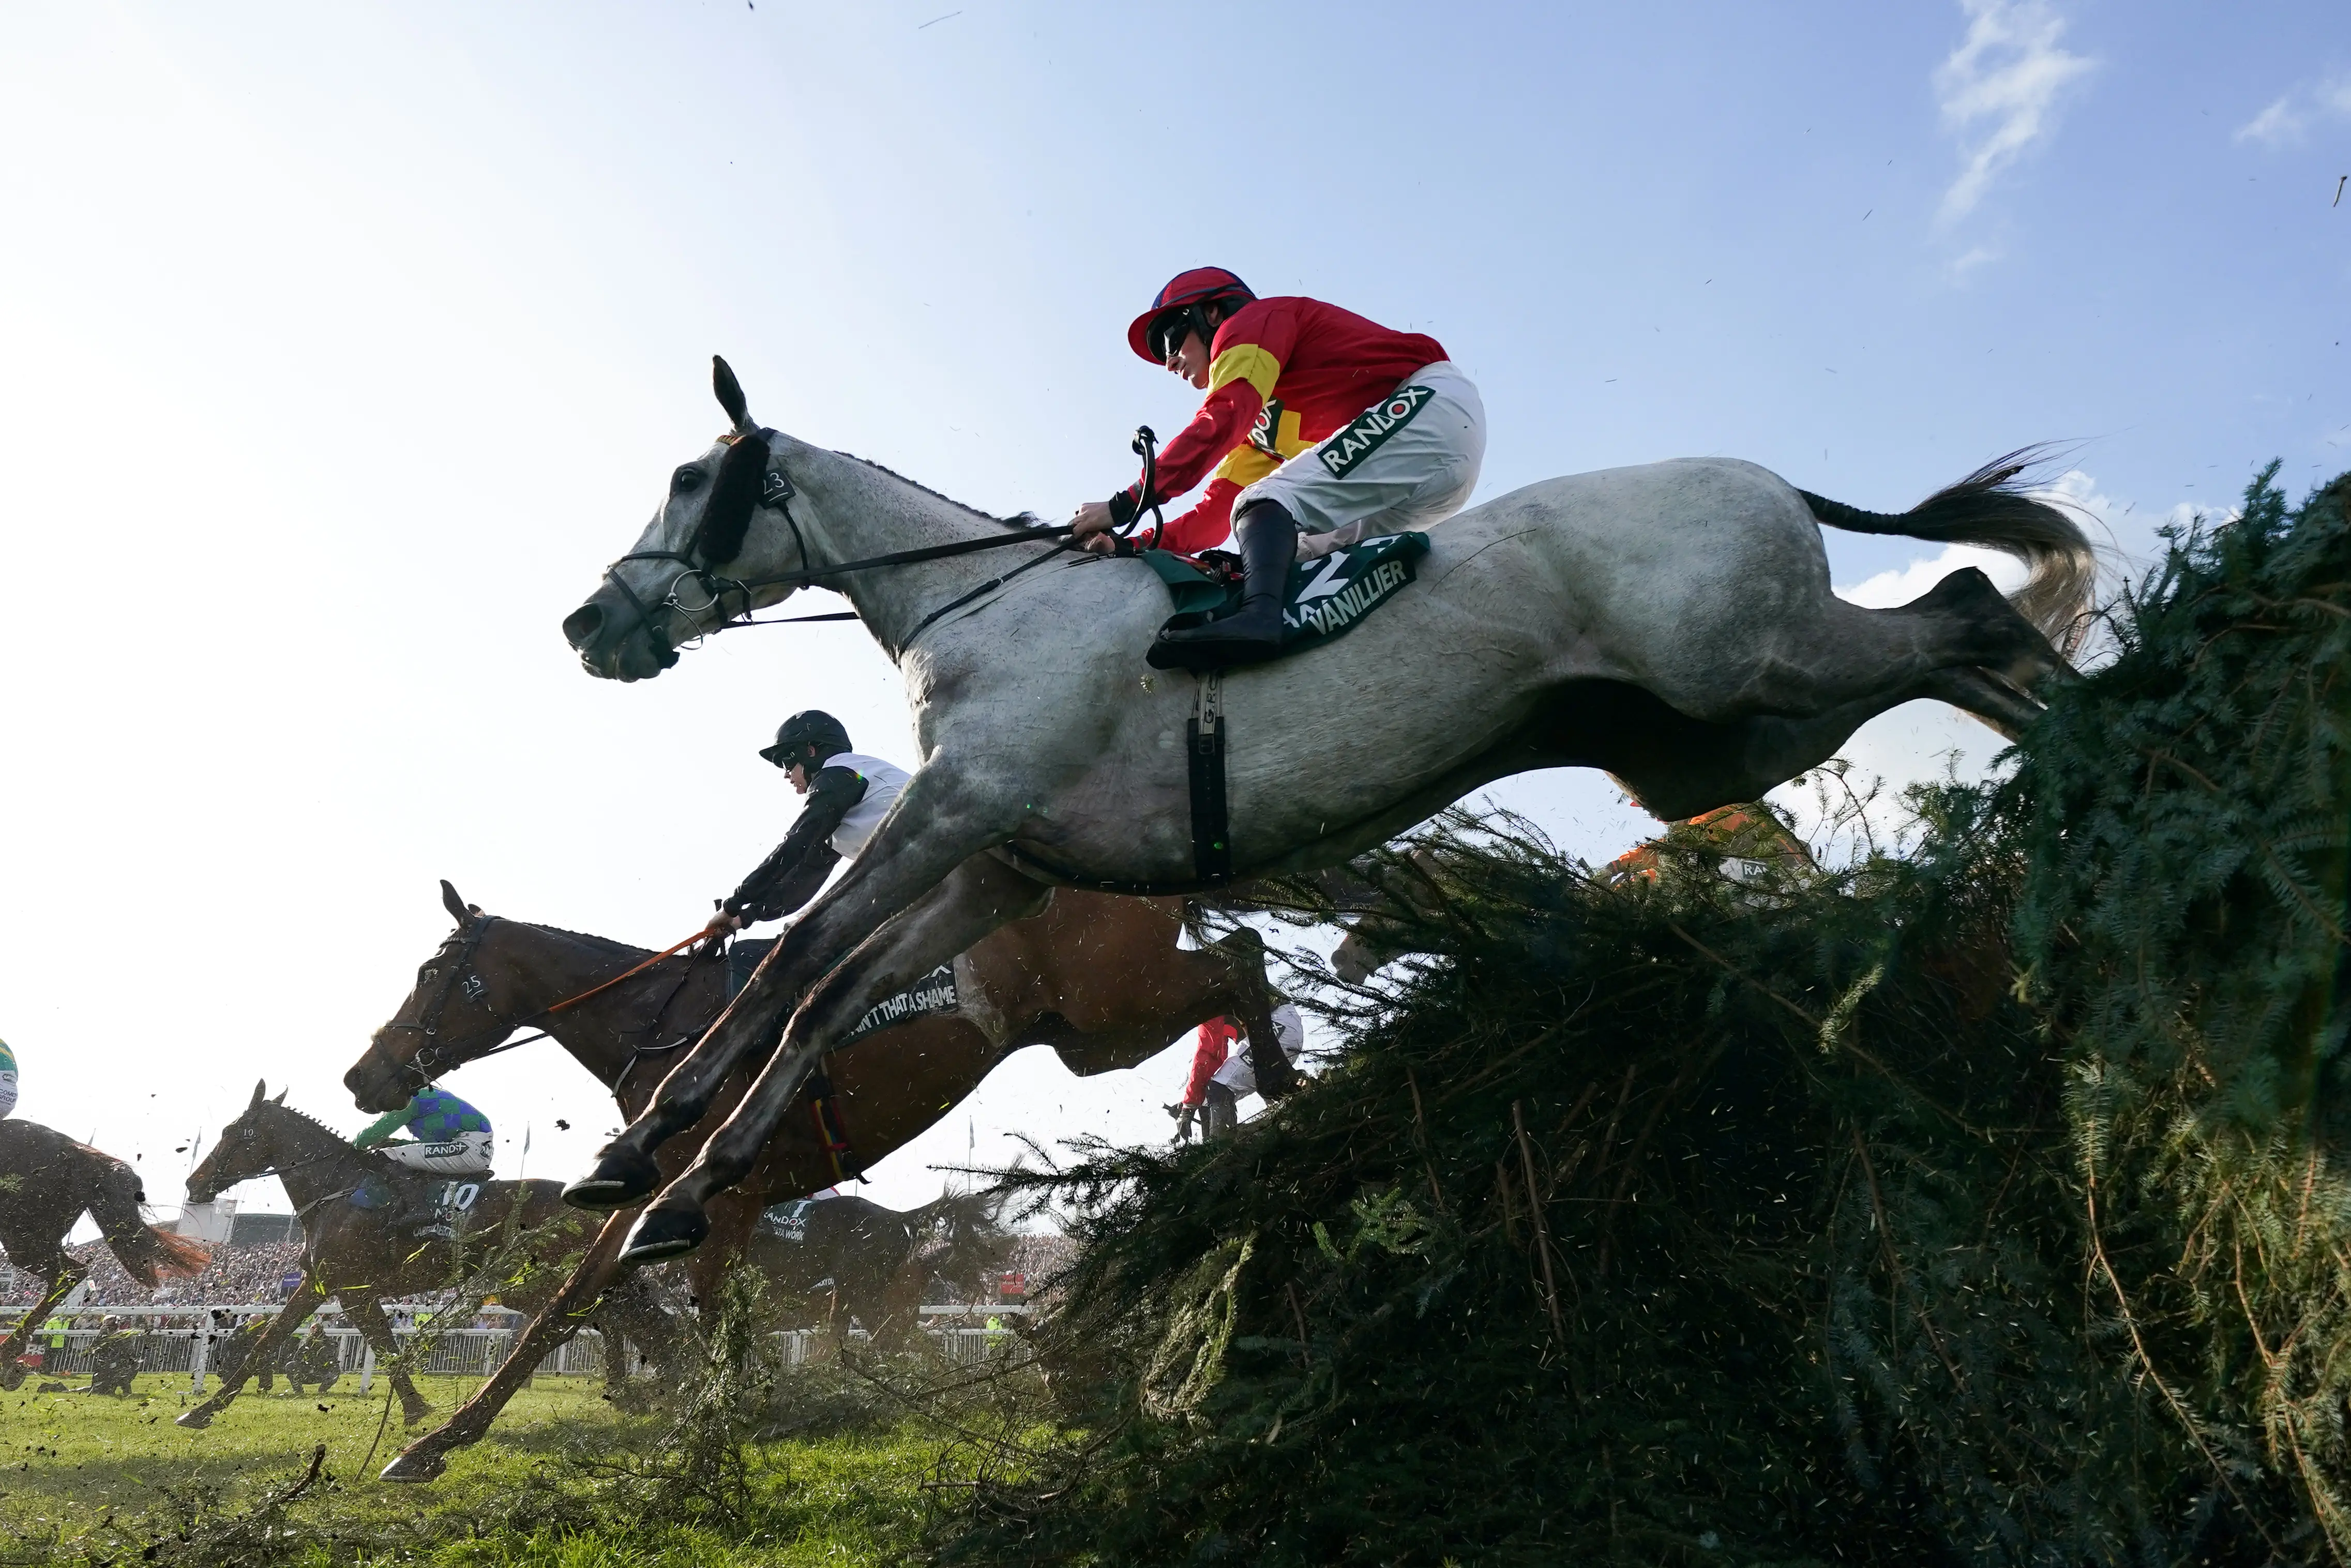
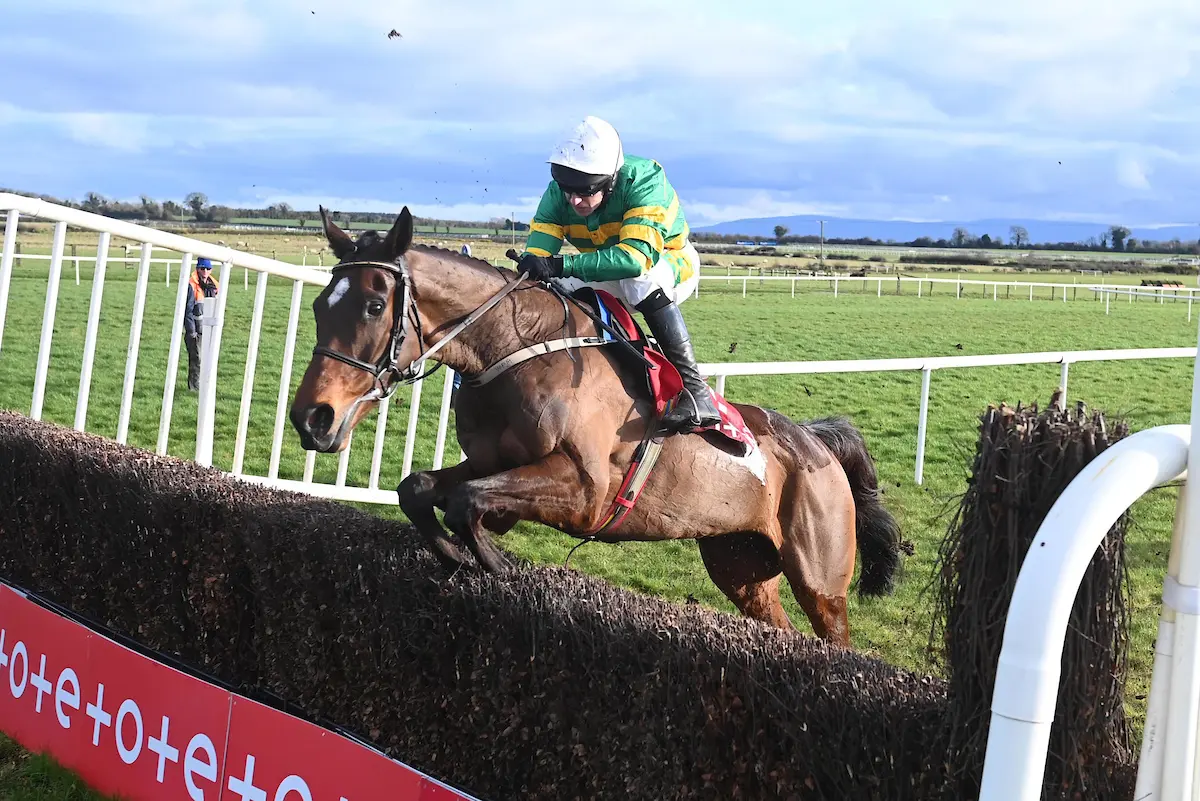
Vanillier lets fly over a fence
Vanillier: where will he find the improvement?
A fine second in last year's race, but unlike Corach Rambler, our Lengths Gained Jumping metric is not so flattering towards him.
In fact, you could say his jumping cost him the spoils last year. Whilst Corach Rambler was busy gaining a +12.66-length advantage through his jumping, Vanillier was losing -5.17 lengths.
Vanillier made up about 10 lengths up the run-in on Corach Rambler and was only beaten two and a quarter lengths. It would be quite safe to assume that the 17.83 length jumping swing affected the outcome.
Vanillier’s jumping doesn’t seem to have improved this season, either.
Over orthodox fences this term, Corach Rambler has been losing only between -3.59 mph and -3.86 mph on average over his fences, which means he is quite slick.
By contrast, Vanillier lost -5.20 mph and -6.12 mph in his races at Fairyhouse and Leopardstown in February. He cannot be discounted, but the RaceiQ data puts a big question mark over whether he can find the improvement to go one better.
I Am Maximus is a safe jumper, but a little ponderous (focusonracing.com)
I Am Maximus: too safe for his own good
He’s clearly a horse blessed with plenty of ability and stamina, but how his jumping, which has come under plenty of scrutiny, stand up to that of Corach Rambler?
I Am Maximus is not an unsafe jumper. In fact, he’s the complete opposite. He is simply too careful, and this is reflected by the data.
Through the speed lost metric, we can see he has lost between -4.88 mph and -5.57 mph in his races this season. He has lost lengths in each one of those races too: Fairyhouse in February: -3.56 LGJ, Leopardstown in February: -14.83 LGJ, Leopardstown in December: -8.76 LGJ, Fairyhouse in December -4.81 LGJ, Cheltenham in March -12.25 LGJ).
He will need to have a massive engine if he is to make up for that over 30 more challenging obstacles.
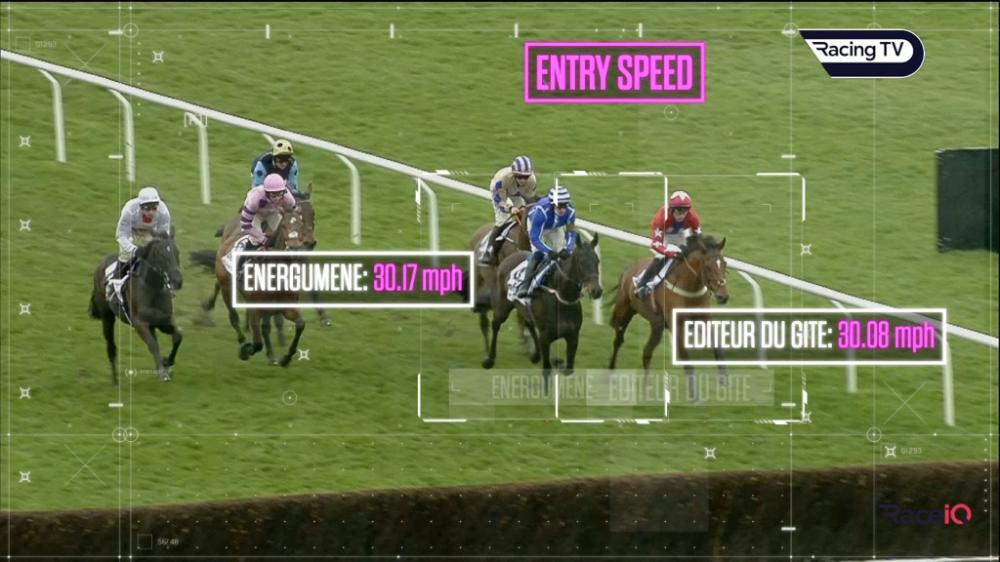
Top Finishing Speed Percentage: Keep Latenightpass in mind
This metric is one many are more familiar with. The Finishing Speed Percentage (FSP) measures how fast a horse is going in the final furlongs - the last four furlongs (half a mile) over Jumps - in comparison to the rest of the race.
This is expressed as a percentage. So, if a horse records an FSP of 110%, it means that he covered the last four furlongs 10% quicker than the rest of the race.
As well as giving us an idea about how a race was run, it also helps us work out which horse has seen out a trip best. A horse with an FSP below 100% is clearly slowing.
Of the top 40 horses in the National handicap (only the top 34 can run), Latenightpass is the horse who we have seen achieve the highest FSP over the past year
This 118.91% FSP was achieved when he landed the cross-country race at Cheltenham in December. This tells us that he was full of running at the end of that 3m5f contest and suggests the extra five furlongs shouldn’t be a problem for him.
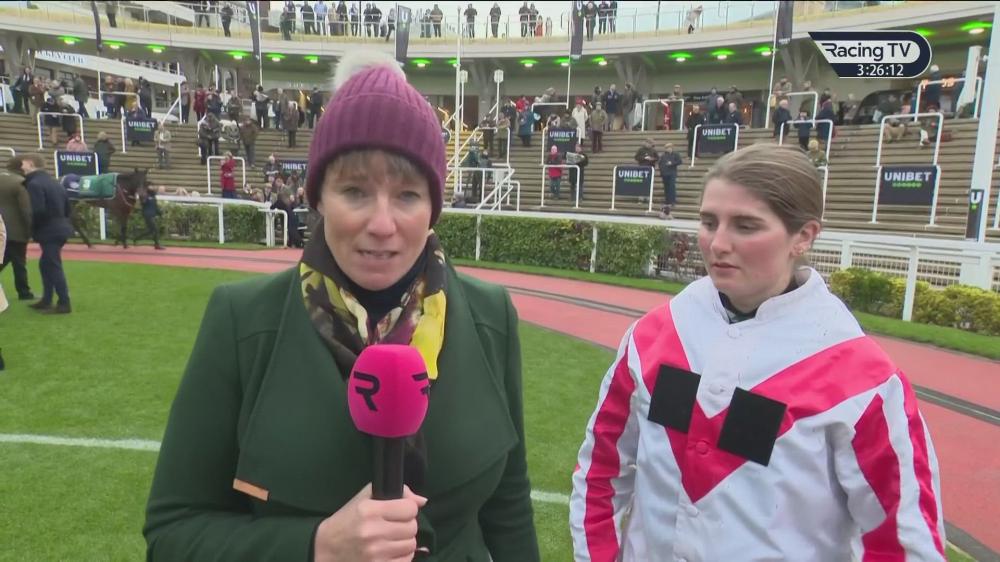
Watch: Christian Williams and Jack Tudor tell us more about Kitty's Light
Least Average Speed Lost: Kitty’s Light wastes no time in the air
One of the metrics that feeds into our “Lengths Gained” data is “Speed Lost”.
This is the amount of speed lost from a horse approaching a jump to the point of landing. We call this the jumping envelope.
It has been used a lot recently, as it is horse specific and has been a useful tool in assessing weaknesses in horses’ jumping, such as when analysising how quick I Am Maximus and Vanillier are from getting from A to B.
It seems that losing less speed is a positive, especially over 4m2f where stamina is a premium, as you don’t want to be constantly using up petrol having to accelerate again after an obstacle.
Kitty’s Light is the horse we have seen lose the least speed over his obstacles over the last year, with his win in the Scottish National last April well worth a closer look.
That day, he only lost -2.64mph on average over his fences, showing how slick he is in the air. He also proved this wasn’t a one off as his win in the Bet365 Chase at Sandown soon after, as that also featured in the Top 10 performances.

Quickest Speed Recovery time: Meetingofthewaters
The Speed Recovery Time is a measure of how quickly a horse recovers to the average race pace.
This helps us measure how quickly a horse can get away from the back of an obstacle, helping us establish any horses that land quite ‘statically’ or take longer to regain their momentum.
The horse we’ve seen with the quickest average Speed Recovery Time was Meetingofthewaters, when he won the Paddy Power Chase at Leopardstown at Christmas.
On average, he took 0.85 seconds to get back up to race pace that day, which shows how powerful he was away from the obstacles.
He was also the horse that gained the most lengths at this year’sCheltenham festival, gaining +17.34 LGJ. His jumping seems sure to stand him in good stead.
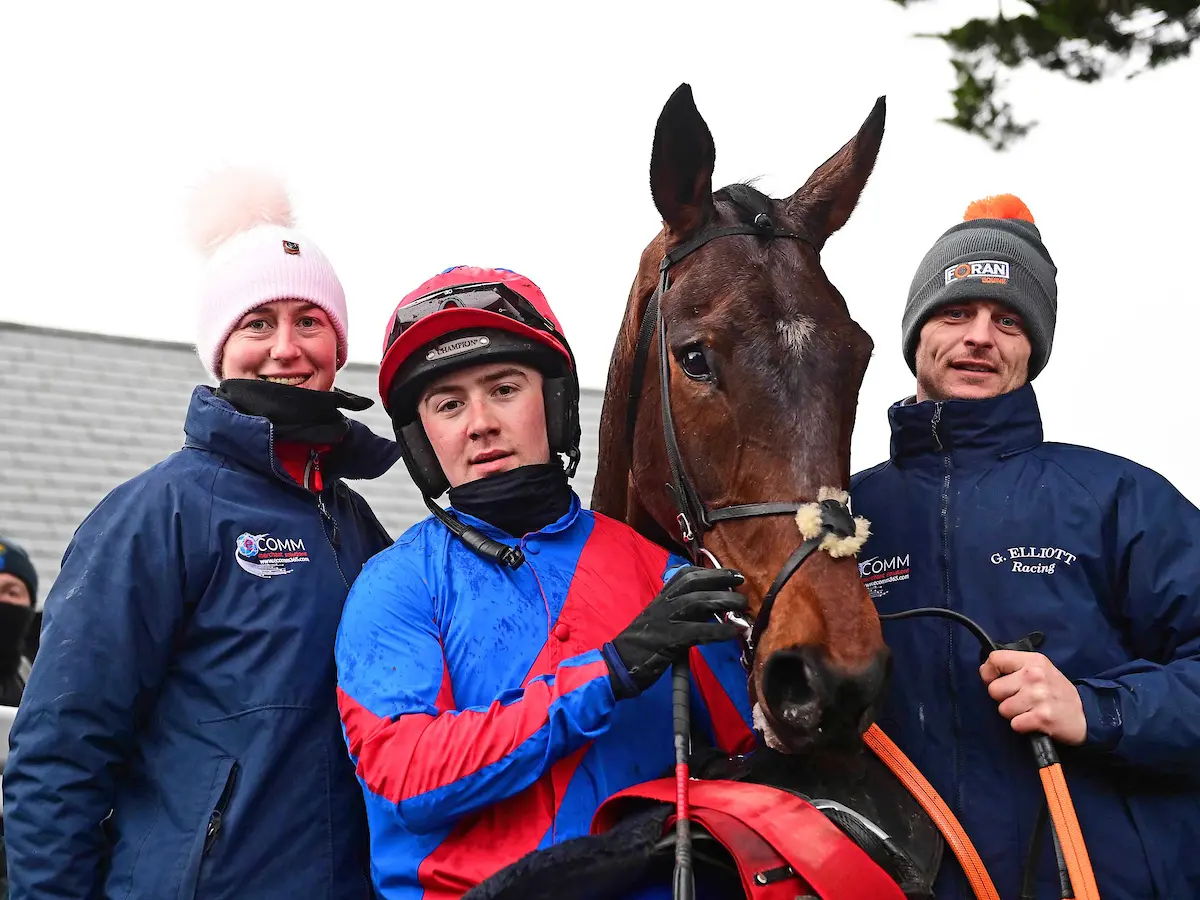
The Goffer and connections. This horse has a big stride on him (Healy Racing)
Average stride length: The Goffer wants good ground
A new metric this month for RaceiQ is the ability to measure a horse’s average stride length and average stride frequency (measured as the number of strides per second) throughout a race.
We are still learning about what exactly this tells us, but from research by others before us, it is a similar concept to anyone who enjoys running.
The ability to increase your frequency helps you go faster, but if you rely on that too much, you could compromise your energy levels. So having a longer stride length means you can cover more ground with less effort.
The Goffer is the horse that we have seen register the highest average stride length with these new metrics. He had an average stride length of 6.62m when a well beaten eight in the Galway Plate last year, but that was over a trip shorter than ideal for him and could back up why he is better suited to the marathon trips.
He hasn’t been in the same form this season, but he wasn’t disgraced in the Ultima at Cheltenham this month. He may be suited to better ground than he had there, enabling him to make more use of his stride.
Top Average Lengths Gained: Glengouly
The horse who on average performed best at his obstacles compared to his rivals was Glengouly in the Thyestes Chase at Gowran in January.
Even though he didn’t manage to win, his jumping gained him 1.48 lengths, on average, at each fence compared to the field. For a race we know is all about jumping, this is surely going to prove an asset for him at Aintree.
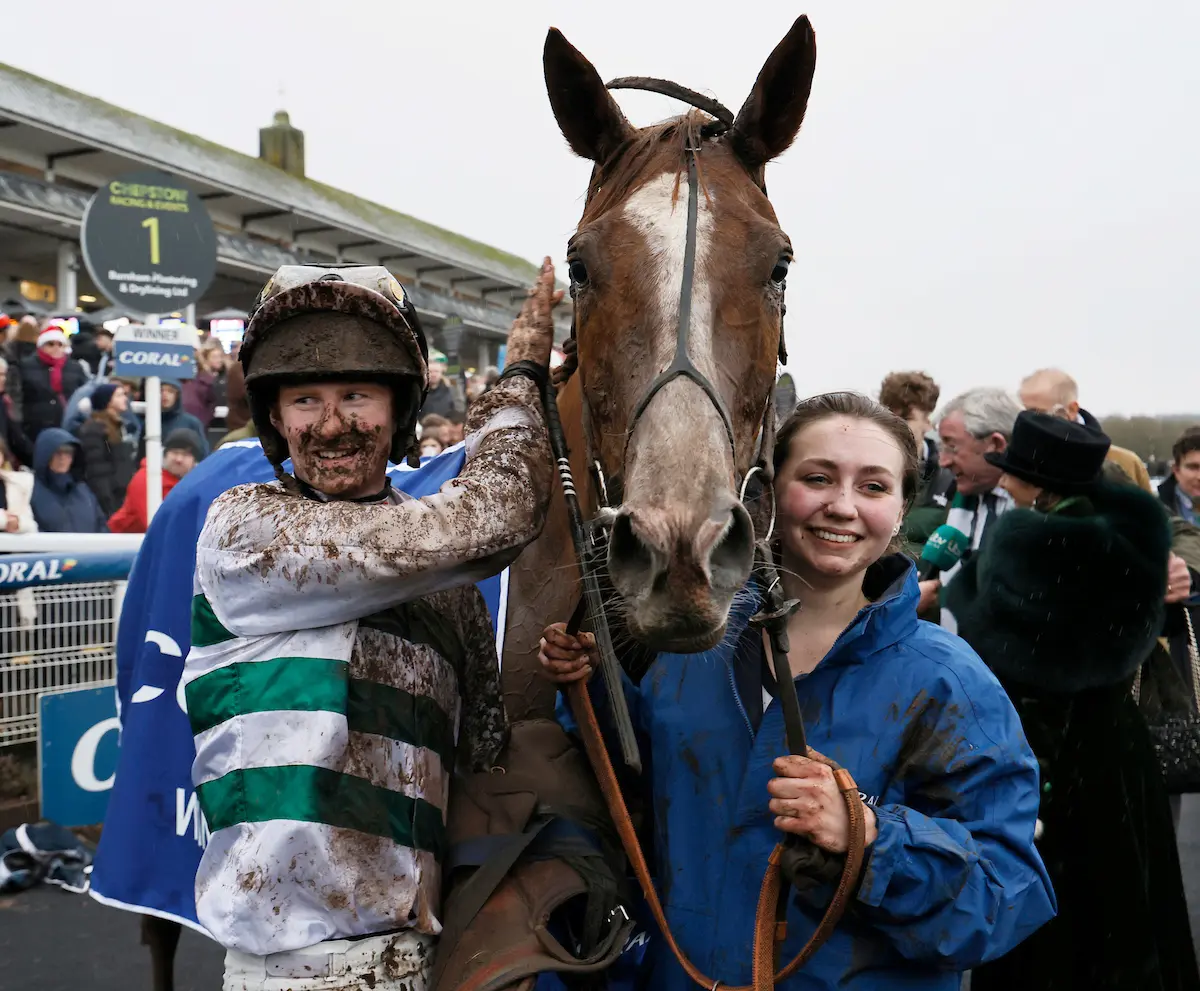
Muddy marvel: Nassalam jumped his rivals into submission at Chepstow (focusonracing.com)
Top Cumulative lengths gained: Nassalam
Nassalam’s demolition job in the Welsh Grand National at Chepstow in December features as one of our highest Lengths Gained Jumping values we’ve seen since we started receiving data last March.
He gained a massive +29.19 length advantage through his jumping, courtesy of his ability to gallop them into the muddy ground that day.
Off the back of that performance, it would be safe to assume that his jumping and staying ability should not be underestimated.
More essential reading and viewing

Don’t miss a second from Aintree and join Racing TV for just £12 a month for an entire year, saving over £215 – OFFER ENDS SUNDAY! Click here for more details.
Related posts
Coral-Eclipse Stakes: Horse-by-horse guide & ante-post tip
Tuesday tips: Dave Nevison's best bets
Johnny Ward's Irish racing tips: Planning a 50-1 Coup!
Wednesday tips: Dave Nevison has bets at Epsom and Thirsk
Juvenile Watch: Winners in waiting plus a tip for Sandown on Friday
Featured offers

Bet £10 get £30 in Free Bets with TalkSportBet
T&Cs Apply
Claim Now

Bet £10 Get £40 in free bets + Money back 2nd to SP fav with BOYLE Sports
T&Cs Apply
Claim Now

Get a £50 free bet when you bet £50 with Coral
T&Cs Apply
Claim Now
Bet £10 get £40 in free bets with Kwiff
T&Cs Apply
Claim Now
Copyright 2026 Racing TV - All Rights Reserved.
Please bet responsibly
Copyright 2026. All rights reserved