Login
WATCH FREE
50+
RaceiQ: five tips on how to make the most of it

By Andy Stephens
Last Updated: Wed 30 Sep 2026
Finding winners can be like a delicious cocktail. You start with a traditional base of horse, trainer and jockey form, then add track, trip, ground and draw into the mix, with a splash of intuition doing no harm.
And these days there is a tasty new ingredient in RaceiQ, the data platform that provides in-depth analysis for every horse performance.
There is plenty to drink in here, with much of it available for free on racingtv.com.
Pace maps can be found in the Racecard section and sectionals and RaceIQ comparisons can be found in the Results section.
I’ve been studying and tipping horses about 35 years, and this has been the biggest game changer in that time.
The plethora of data available forms an integral part of my form study. I still watch and rewatch as many races as ever, but RaceiQ fills in gaps and provides multiple layers of fresh information.
Here’s five ways I use it.
1 Lengths Gained Jumping & Jump Index
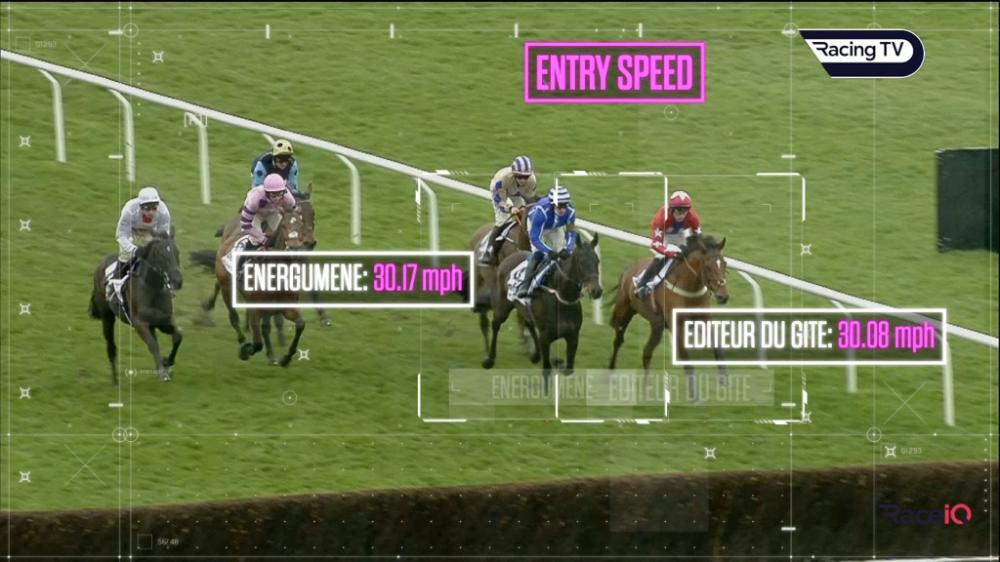
This was the first modelled metric launched by RaceiQ. It uses detailed GPS tracking data to objectively quantify a horse’s jumping advantage, or disadvantage.
Horses who gain lots of lengths can be seductive but keep in mind the figure is relative to how all the horses in a race have jumped. The overall Jump Index score is a better overall guide to a horse’s prowess in this department.
Also, don’t ignore those who lose lengths. I napped Hung Jury when he won at 28-1 at Cheltenham last November after he had been beaten about 12 lengths at the same track the previous month. RaceiQ revealed this safe but slow jumper had lost 27 lengths negotiating the fences.
Hung Jury had much deeper ground more to his liking, and I figured that if he could get from A to B a bit quicker then he would have to be competitive. As it transpired, he lost less than a length and was a convincing winner.
2 Finishing Speed Percentages
The majority of winners have the highest Finishing Speed Percentages (FSP), but finding also rans with the best FSP can be lucrative, as they can slip under the radar.
Make a note of Wild Dahlia, a lightly raced filly trained by William Haggas who did that when fourth in a nine-furlong handicap at Epsom last time. She is entered at Redcar on Saturday.

3 Sectional Timing
There are five different colour shades showing whether horses have run Very Slow, Slow, Par, Fast or Very Fast furlongs. Blue equals slow. Red means fast.
I pay extra attention to those who can manage a splash of “red” at the end of their races when most of the others are “blue”.
A recent example was provided by Aalto, who clocked a "fast" final furlong of 11.83 seconds when runner-up at Newbury on Saturday. Look out for him if he runs in the big 7f handicap at Ascot on Saturday week.
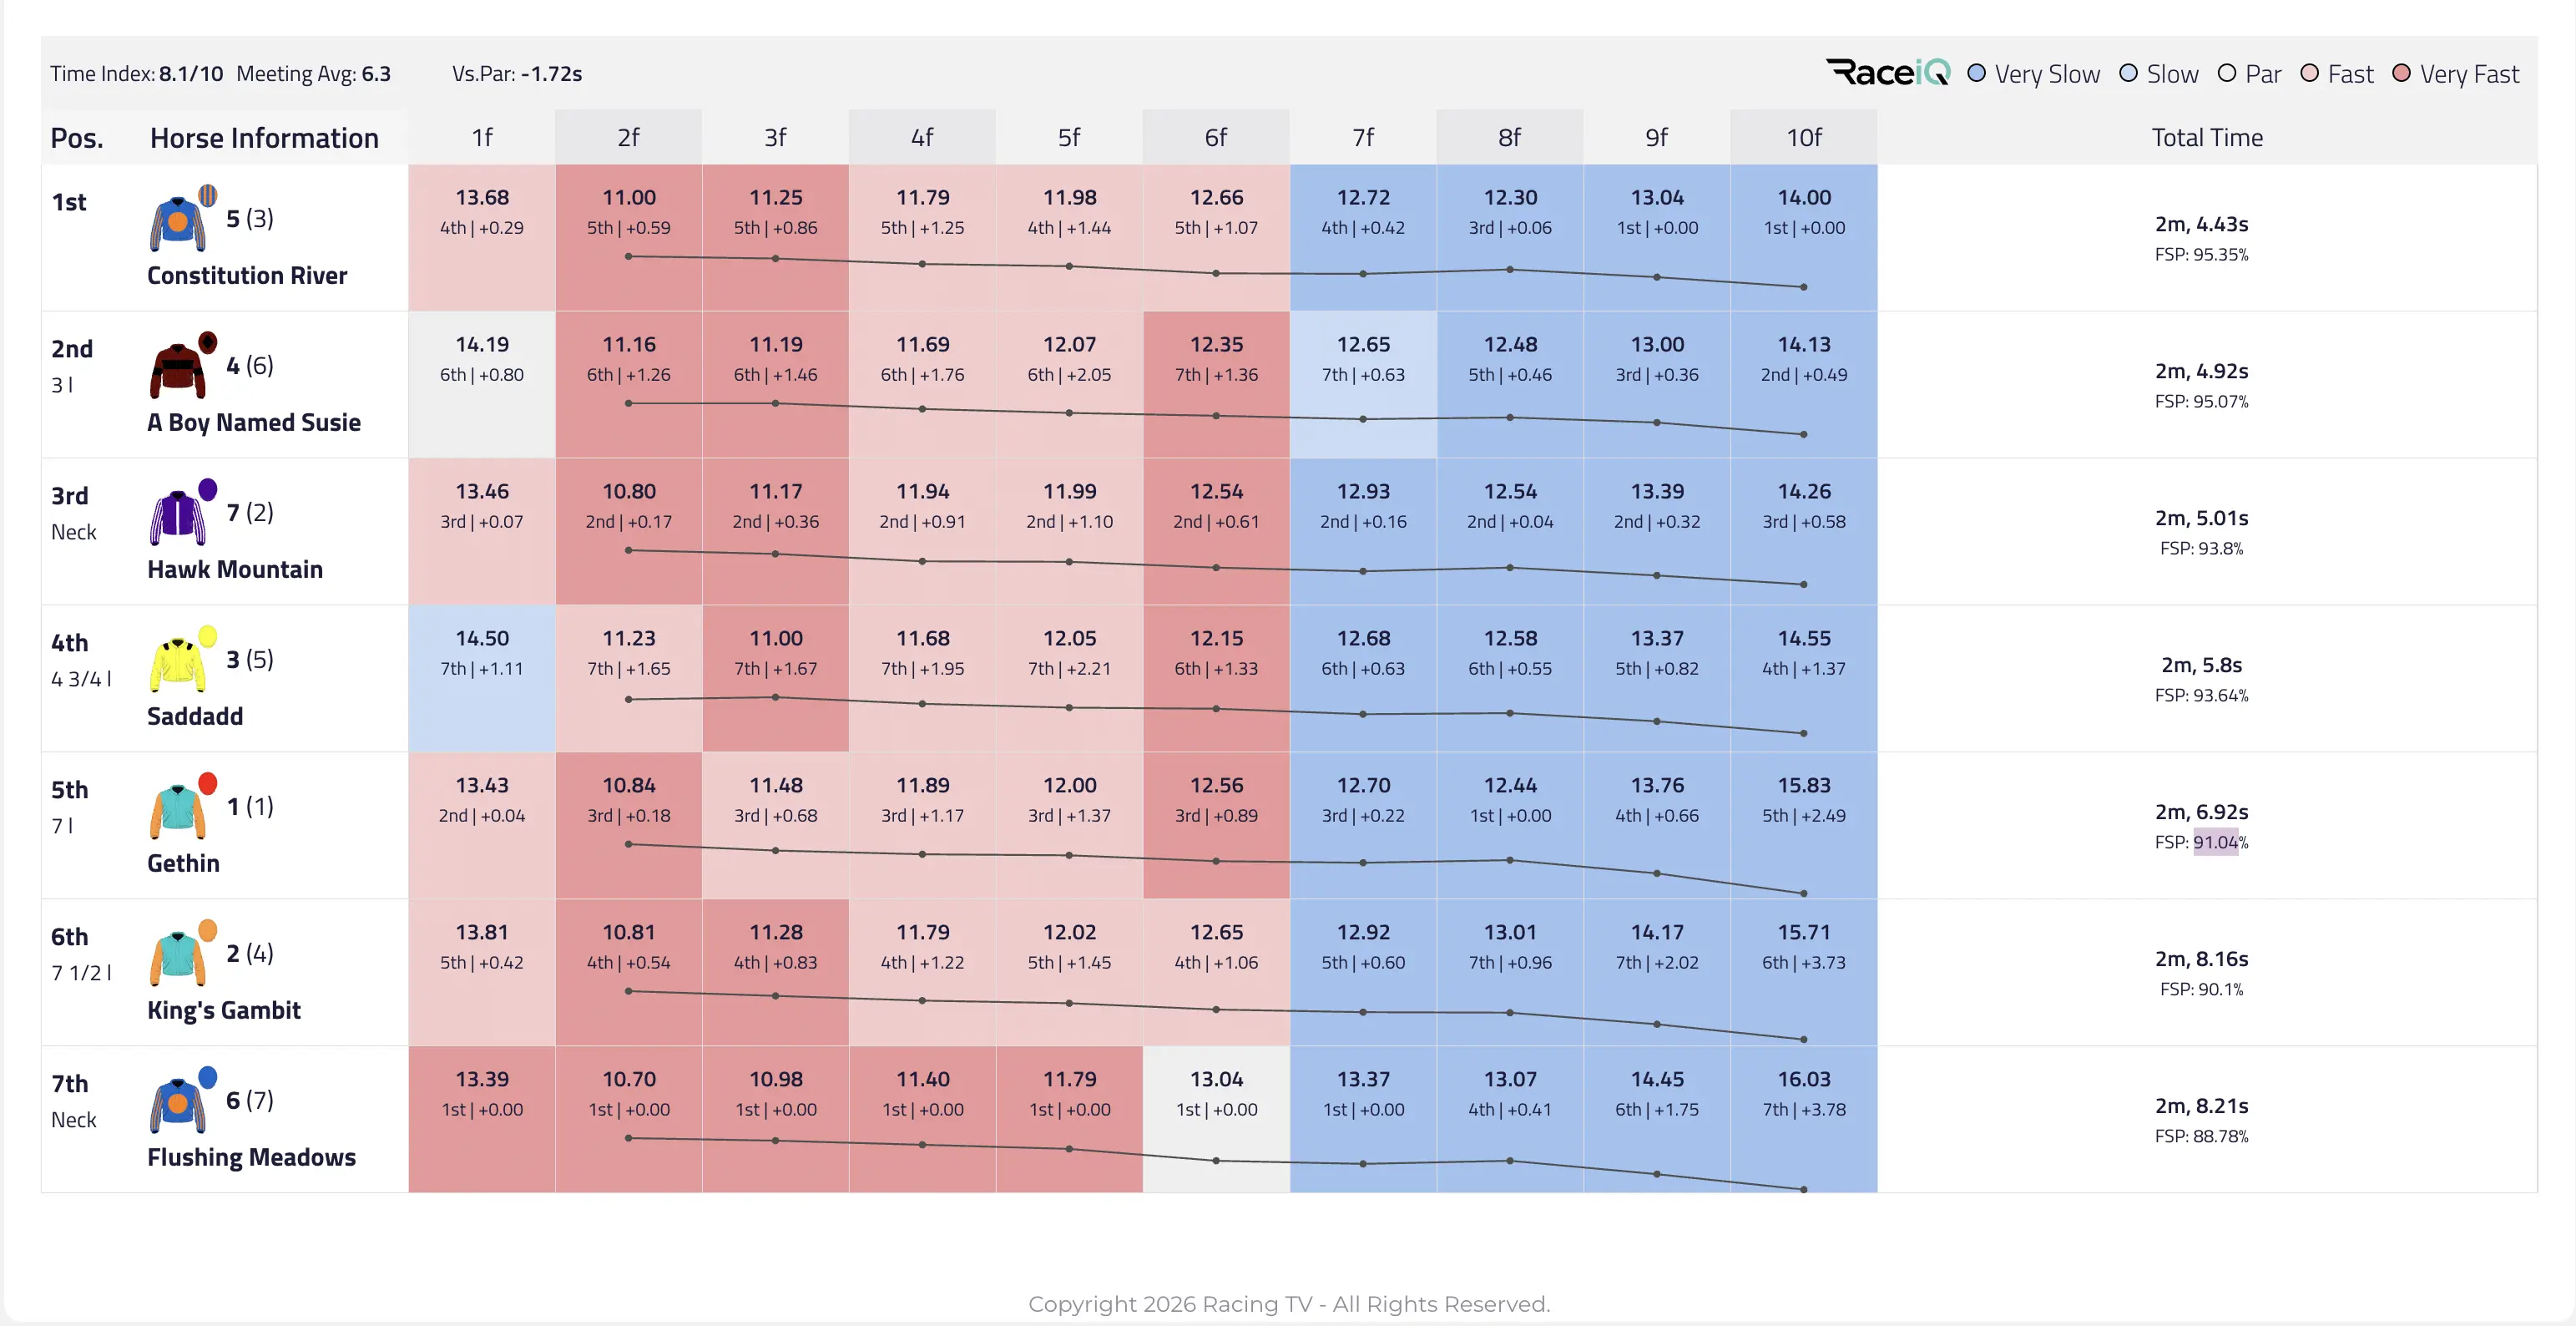
An example of the RaceiQ sectionals.
4 Time Index
Winners who get a Time Index score much bigger than the meeting average tells you they have clocked a fast time relative to the grade of race and official ground conditions.
Those who win by a decisive margin will not escape attention, but on occasions you can get a decent Time Index and a close finish, with the horses involved perhaps not raised by as much as their efforts have merited.
By the same token, do not discount races that yield slow Time Index scores, especially if they are won, or nearly won, by those who have pounced from off that steady gallop.
5 Stride Data
Horses moving up or down in distance for the first time provide a puzzle but studying the stride data can provide an edge.
Thoroughbreds who can turn over lots of strides per second are generally favoured by sprint distances, while those who stride slower invariably stay well.
Stride patterns are a constant throughout a horse’s career. This can provide glimpses of what trips might suit best from an early age.
Gavriel was a fine fourth in the Cambridgeshire over 9f at Newmarket on Saturday, when first home on the stands' side. His high stride cadence hints he may be even more potent dropped to a mile, or even 7f.
Enjoy our RaceiQ pace maps

Related posts
Dave Nevison's Wednesday tips after 106-1 and 260-1 trebles
Prix de l'Arc de Triomphe: who will be suited by the ground?
Your essential guide to the 2026 Prix de l’Arc de Triomphe
Under The Radar: O'Sullivan's Chally Chute plans and four to note
Tuesday tips: Dave Nevison's three best bets at Ayr
Featured offers

Bet £10 Get £40 in free bets + Money back 2nd to SP fav with BOYLE Sports
T&Cs Apply
Claim Now
BOYLE Sports: Bet £10 Get £40 in free bets + Money back 2nd to SP fav with BOYLE Sports. 18+ GambleAware

Bet £10 get £40 in free bets with Kwiff
T&Cs Apply
Claim Now
New UK customers. Place a £10 real money bet at min. 2.0 odds within 5 days of deposit. Get 4 x £10 Free Bets: 1 Single, 2 Accas & 1 Bet Builder (min. 3 selections each). Excludes cashout, E/W, Multis, Ineligible Markets & Odds Boosts. Credited after bet settlement. 7-day expiry. T&Cs apply. 18+ GambleAware

Get 50% back up to £50 with QuinnBet
T&Cs Apply
Claim Now
New UK Customers Only. Bet £10+ on any sportsbook markets at odds of evens (2.00) or greater. Get 50% back of your first day’s losses as a Free Bet up to £50, valid for 7 days. 18+ GambleAware.

Bet £10 get £30 in Free Bets with talkSPORT BET
T&Cs Apply
Claim Now
talkSPORT BET: Bet £10 get £30 in Horse Racing Free Bets. 18+ GambleAware

Bet £20 and Get £40 in Free Bets with Unibet
T&Cs Apply
Claim Now
Unibet: Bet £20 and Get £40 in Free Bets with Unibet
Copyright 2026 Racing TV - All Rights Reserved.
Please bet responsibly
Copyright 2026. All rights reserved