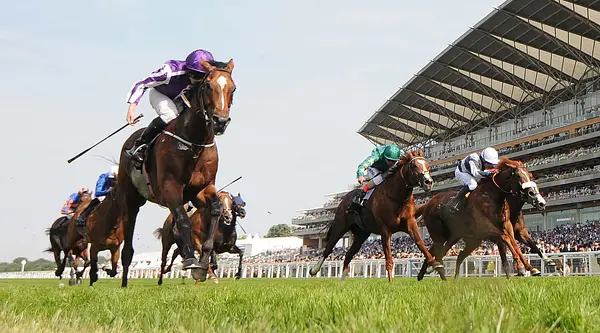
Ascot Racing Results | 22nd November 2025 12:55

12:55 Ascot

Get Your Ladbrokes Free Ascot Bet Mares' Handicap Hurdle (Class 3) (Turf)

Good (Good To Soft In Places) 4YO+ 2m 7f 123y Winner: £9,585 (12 runners)

RESULT
RACEiQ COMPARISON
SECTIONALS
Result tutorial
Settings
Show All
POS.
NO./
DRAW HORSE
AGE/WGT.
SP
Towards rear, headway 3 out, ridden to lead 2 out, joined before last, regained lead after last, ran on well
View Less
Race Metrics
Jump Index
7.3/10
2
ND
Lengths Gained Jumping
12.63L
1
ST
Top Speed
34.42MPH
10
TH
Finishing Speed %
98.87%
1
ST
Jumping Data Averages
Entry Speed
4
TH
30.24MPH
Speed Lost
2
ND
-1.98MPH
Time in Envelope
1
ST
4.66S
Exit Speed
1
ST
29.96MPH
Recovery Time
1
ST
0.80S
Positive Jump %
1
ST
90.91%
Stride Data
Min Frequency
3
RD
2.02SPS
Avg Frequency
7
TH
2.14SPS
Max Frequency
3
RD
2.31SPS
Min Length
3
RD
5.71M
Avg Length
6
TH
6.41M
Max Length
7
TH
7.23M
Track Horse
Notifications
save
Midfield, ridden and headway 2 out, joined winner last, headed after last, kept on
View Data
Race Metrics
Jump Index
6.9/10
3
RD
Lengths Gained Jumping
10.64L
2
ND
Top Speed
34.19MPH
12
TH
Finishing Speed %
98.50%
2
ND
Jumping Data Averages
Entry Speed
3
RD
30.27MPH
Speed Lost
3
RD
-2.24MPH
Time in Envelope
2
ND
4.68S
Exit Speed
2
ND
29.59MPH
Recovery Time
4
TH
1.16S
Positive Jump %
3
RD
63.64%
Stride Data
Min Frequency
5
TH
1.98SPS
Avg Frequency
11
TH
2.06SPS
Max Frequency
10
TH
2.18SPS
Min Length
2
ND
5.82M
Avg Length
2
ND
6.68M
Max Length
5
TH
7.35M
Track Horse
Notifications
save
Midfield, headway 3 out, ridden with leaders 2 out, no extra after last
View Data
Race Metrics
Jump Index
6.5/10
6
TH
Lengths Gained Jumping
8.28L
3
RD
Top Speed
35.06MPH
3
RD
Finishing Speed %
96.76%
3
RD
Jumping Data Averages
Entry Speed
1
ST
30.54MPH
Speed Lost
8
TH
-2.73MPH
Time in Envelope
3
RD
4.70S
Exit Speed
3
RD
29.58MPH
Recovery Time
2
ND
1.03S
Positive Jump %
5
TH
54.55%
Stride Data
Min Frequency
1
ST
2.07SPS
Avg Frequency
4
TH
2.17SPS
Max Frequency
4
TH
2.30SPS
Min Length
4
TH
5.63M
Avg Length
7
TH
6.35M
Max Length
9
TH
7.12M
Track Horse
Notifications
save
Midfield, ridden and headway 2 out, no extra after last
View Data
Race Metrics
Jump Index
6.3/10
10
TH
Lengths Gained Jumping
4.28L
4
TH
Top Speed
34.91MPH
5
TH
Finishing Speed %
95.02%
4
TH
Jumping Data Averages
Entry Speed
2
ND
30.28MPH
Speed Lost
11
TH
-2.99MPH
Time in Envelope
4
TH
4.77S
Exit Speed
4
TH
29.24MPH
Recovery Time
7
TH
1.44S
Positive Jump %
6
TH
45.46%
Stride Data
Min Frequency
10
TH
1.89SPS
Avg Frequency
12
TH
1.99SPS
Max Frequency
12
TH
2.10SPS
Min Length
1
ST
6.05M
Avg Length
1
ST
6.90M
Max Length
1
ST
7.77M
Track Horse
Notifications
save
Midfield, headway 4 out, ridden 2 out, weakened before last
View Data
Race Metrics
Jump Index
6.1/10
12
TH
Lengths Gained Jumping
-2.96L
9
TH
Top Speed
34.65MPH
8
TH
Finishing Speed %
89.40%
5
TH
Jumping Data Averages
Entry Speed
6
TH
29.52MPH
Speed Lost
12
TH
-3.08MPH
Time in Envelope
7
TH
4.90S
Exit Speed
8
TH
28.58MPH
Recovery Time
12
TH
2.49S
Positive Jump %
10
TH
27.27%
Stride Data
Min Frequency
6
TH
1.98SPS
Avg Frequency
2
ND
2.21SPS
Max Frequency
1
ST
2.33SPS
Min Length
7
TH
5.25M
Avg Length
10
TH
6.24M
Max Length
8
TH
7.16M
Track Horse
Notifications
save
Led, ridden and headed 2 out, weakened before last
View Data
Race Metrics
Jump Index
6.7/10
4
TH
Lengths Gained Jumping
1.50L
5
TH
Top Speed
34.98MPH
4
TH
Finishing Speed %
89.31%
7
TH
Jumping Data Averages
Entry Speed
5
TH
29.63MPH
Speed Lost
5
TH
-2.48MPH
Time in Envelope
6
TH
4.85S
Exit Speed
10
TH
28.51MPH
Recovery Time
8
TH
1.47S
Positive Jump %
2
ND
81.82%
Stride Data
Min Frequency
8
TH
1.94SPS
Avg Frequency
9
TH
2.08SPS
Max Frequency
8
TH
2.20SPS
Min Length
9
TH
5.16M
Avg Length
5
TH
6.50M
Max Length
3
RD
7.39M
Track Horse
Notifications
save
Prominent, ridden 3 out, weakened before 2 out
View Data
Race Metrics
Jump Index
6.4/10
7
TH
Lengths Gained Jumping
0.91L
6
TH
Top Speed
35.33MPH
1
ST
Finishing Speed %
89.31%
6
TH
Jumping Data Averages
Entry Speed
7
TH
29.39MPH
Speed Lost
4
TH
-2.47MPH
Time in Envelope
5
TH
4.85S
Exit Speed
9
TH
28.53MPH
Recovery Time
9
TH
1.69S
Positive Jump %
3
RD
63.64%
Stride Data
Min Frequency
11
TH
1.88SPS
Avg Frequency
8
TH
2.09SPS
Max Frequency
11
TH
2.17SPS
Min Length
5
TH
5.50M
Avg Length
3
RD
6.55M
Max Length
4
TH
7.37M
Track Horse
Notifications
save
Never better than midfield
View Data
Race Metrics
Jump Index
6.5/10
5
TH
Lengths Gained Jumping
-1.87L
8
TH
Top Speed
34.66MPH
7
TH
Finishing Speed %
89.02%
9
TH
Jumping Data Averages
Entry Speed
9
TH
29.26MPH
Speed Lost
6
TH
-2.59MPH
Time in Envelope
8
TH
4.90S
Exit Speed
5
TH
28.69MPH
Recovery Time
10
TH
1.70S
Positive Jump %
10
TH
27.27%
Stride Data
Min Frequency
4
TH
2.00SPS
Avg Frequency
3
RD
2.20SPS
Max Frequency
2
ND
2.33SPS
Min Length
11
TH
5.07M
Avg Length
11
TH
6.22M
Max Length
11
TH
6.96M
Track Horse
Notifications
save
Always towards rear
View Data
Race Metrics
Jump Index
6.3/10
9
TH
Lengths Gained Jumping
-3.13L
10
TH
Top Speed
34.45MPH
9
TH
Finishing Speed %
89.17%
8
TH
Jumping Data Averages
Entry Speed
8
TH
29.34MPH
Speed Lost
9
TH
-2.74MPH
Time in Envelope
9
TH
4.91S
Exit Speed
6
TH
28.64MPH
Recovery Time
11
TH
2.17S
Positive Jump %
9
TH
36.36%
Stride Data
Min Frequency
7
TH
1.94SPS
Avg Frequency
5
TH
2.16SPS
Max Frequency
7
TH
2.23SPS
Min Length
10
TH
5.14M
Avg Length
9
TH
6.31M
Max Length
6
TH
7.28M
Track Horse
Notifications
save
Always in rear
View Data
Race Metrics
Jump Index
7.4/10
1
ST
Lengths Gained Jumping
-0.77L
7
TH
Top Speed
34.23MPH
11
TH
Finishing Speed %
85.17%
10
TH
Jumping Data Averages
Entry Speed
10
TH
28.84MPH
Speed Lost
1
ST
-1.86MPH
Time in Envelope
10
TH
4.93S
Exit Speed
7
TH
28.64MPH
Recovery Time
3
RD
1.11S
Positive Jump %
6
TH
45.46%
Stride Data
Min Frequency
2
ND
2.02SPS
Avg Frequency
1
ST
2.21SPS
Max Frequency
5
TH
2.30SPS
Min Length
12
TH
4.90M
Avg Length
12
TH
6.17M
Max Length
12
TH
6.87M
Track Horse
Notifications
save
Chased leader, ridden and weakened 2 out, pulled up before last
View Data
Race Metrics
Jump Index
6.2/10
11
TH
Lengths Gained Jumping
-6.09L
11
TH
Top Speed
35.17MPH
2
ND
FSP
Pending Official Sectional Data
Jumping Data Averages
Entry Speed
11
TH
28.81MPH
Speed Lost
10
TH
-2.95MPH
Time in Envelope
12
TH
5.23S
Exit Speed
11
TH
27.67MPH
Recovery Time
5
TH
1.17S
Positive Jump %
6
TH
45.46%
Stride Data
Min Frequency
12
TH
1.86SPS
Avg Frequency
10
TH
2.08SPS
Max Frequency
9
TH
2.19SPS
Min Length
6
TH
5.39M
Avg Length
4
TH
6.53M
Max Length
2
ND
7.49M
Track Horse
Notifications
save
Midfield, ridden and weakened 3 out, soon pulled up
View Data
Race Metrics
Jump Index
6.4/10
8
TH
Lengths Gained Jumping
-8.86L
12
TH
Top Speed
34.69MPH
6
TH
FSP
Pending Official Sectional Data
Jumping Data Averages
Entry Speed
12
TH
28.35MPH
Speed Lost
7
TH
-2.65MPH
Time in Envelope
11
TH
5.22S
Exit Speed
12
TH
27.53MPH
Recovery Time
6
TH
1.33S
Positive Jump %
12
TH
18.18%
Stride Data
Min Frequency
9
TH
1.91SPS
Avg Frequency
6
TH
2.15SPS
Max Frequency
6
TH
2.25SPS
Min Length
8
TH
5.17M
Avg Length
8
TH
6.33M
Max Length
10
TH
7.12M
Track Horse
Notifications
save
12 ran.
Winning time 5min, 48.57s
1st owner
Shaw Racing & Graeme McPherson
2nd owner
Noel Fehily Racing Syndicate - Star
3rd owner
Andrew Gemmell & Richard Lavelle
Tote:
Win
5.30
Place
1.70, 2.50, 4.90
Exacta
35.20
Trifecta
357.80
Swinger
11.20, 6.30, 24.30
Comparison tutorial
By Metric
Show All
Jump Index
POS.
HORSE
RANK
DATA
1st
Rockola Vogue
2nd
Star Walking
3rd
Porter In The Park
4th
Bobbi With An I
5th
Shantwopointfive
6th
Spit Spot
7th
Moviddy
8th
Gaye Legacy
9th
Notnowlinda
10th
Mermaids Cave
P
Presenting Doy
P
Good Look Charm
2
ND
7.3
/10
3
RD
6.9
/10
6
TH
6.5
/10
10
TH
6.3
/10
12
TH
6.1
/10
4
TH
6.7
/10
7
TH
6.4
/10
5
TH
6.5
/10
9
TH
6.3
/10
1
ST
7.4
/10
11
TH
6.2
/10
8
TH
6.4
/10
Median
Lengths Gained Jumping
POS.
HORSE
RANK
DATA
1st
Rockola Vogue
2nd
Star Walking
3rd
Porter In The Park
4th
Bobbi With An I
5th
Shantwopointfive
6th
Spit Spot
7th
Moviddy
8th
Gaye Legacy
9th
Notnowlinda
10th
Mermaids Cave
P
Presenting Doy
P
Good Look Charm
1
ST
12.63
L
2
ND
10.64
L
3
RD
8.28
L
4
TH
4.28
L
9
TH
-2.96
L
5
TH
1.50
L
6
TH
0.91
L
8
TH
-1.87
L
10
TH
-3.13
L
7
TH
-0.77
L
11
TH
-6.09
L
12
TH
-8.86
L
Median
Finishing Speed %
POS.
HORSE
RANK
DATA
1st
Rockola Vogue
2nd
Star Walking
3rd
Porter In The Park
4th
Bobbi With An I
5th
Shantwopointfive
6th
Spit Spot
7th
Moviddy
8th
Gaye Legacy
9th
Notnowlinda
10th
Mermaids Cave
1
ST
98.87
%
2
ND
98.50
%
3
RD
96.76
%
4
TH
95.02
%
5
TH
89.40
%
7
TH
89.31
%
6
TH
89.31
%
9
TH
89.02
%
8
TH
89.17
%
10
TH
85.17
%
Median
Top Speed
POS.
HORSE
RANK
DATA
1st
Rockola Vogue
2nd
Star Walking
3rd
Porter In The Park
4th
Bobbi With An I
5th
Shantwopointfive
6th
Spit Spot
7th
Moviddy
8th
Gaye Legacy
9th
Notnowlinda
10th
Mermaids Cave
P
Presenting Doy
P
Good Look Charm
10
TH
34.42
MPH
12
TH
34.19
MPH
3
RD
35.06
MPH
5
TH
34.91
MPH
8
TH
34.65
MPH
4
TH
34.98
MPH
1
ST
35.33
MPH
7
TH
34.66
MPH
9
TH
34.45
MPH
11
TH
34.23
MPH
2
ND
35.17
MPH
6
TH
34.69
MPH
Median
Speed Lost
POS.
HORSE
RANK
DATA
1st
Rockola Vogue
2nd
Star Walking
3rd
Porter In The Park
4th
Bobbi With An I
5th
Shantwopointfive
6th
Spit Spot
7th
Moviddy
8th
Gaye Legacy
9th
Notnowlinda
10th
Mermaids Cave
P
Presenting Doy
P
Good Look Charm
2
ND
-1.98
MPH
3
RD
-2.24
MPH
8
TH
-2.73
MPH
11
TH
-2.99
MPH
12
TH
-3.08
MPH
5
TH
-2.48
MPH
4
TH
-2.47
MPH
6
TH
-2.59
MPH
9
TH
-2.74
MPH
1
ST
-1.86
MPH
10
TH
-2.95
MPH
7
TH
-2.65
MPH
Median
Entry Speed
POS.
HORSE
RANK
DATA
1st
Rockola Vogue
2nd
Star Walking
3rd
Porter In The Park
4th
Bobbi With An I
5th
Shantwopointfive
6th
Spit Spot
7th
Moviddy
8th
Gaye Legacy
9th
Notnowlinda
10th
Mermaids Cave
P
Presenting Doy
P
Good Look Charm
4
TH
30.24
MPH
3
RD
30.27
MPH
1
ST
30.54
MPH
2
ND
30.28
MPH
6
TH
29.52
MPH
5
TH
29.63
MPH
7
TH
29.39
MPH
9
TH
29.26
MPH
8
TH
29.34
MPH
10
TH
28.84
MPH
11
TH
28.81
MPH
12
TH
28.35
MPH
Median
By Horse
Show All
Rockola Vogue
METRIC
RANK
DATA
Jump Index
2
ND
7.3/10
LGJ
1
ST
12.63L
FSP
1
ST
98.87%
Top Speed
10
TH
34.42MPH
Speed Lost
2
ND
-1.98MPH
Entry Speed
4
TH
30.24MPH
Median
Star Walking
METRIC
RANK
DATA
Jump Index
3
RD
6.9/10
LGJ
2
ND
10.64L
FSP
2
ND
98.5%
Top Speed
12
TH
34.19MPH
Speed Lost
3
RD
-2.24MPH
Entry Speed
3
RD
30.27MPH
Median
Porter In The Park
METRIC
RANK
DATA
Jump Index
6
TH
6.5/10
LGJ
3
RD
8.28L
FSP
3
RD
96.76%
Top Speed
3
RD
35.06MPH
Speed Lost
8
TH
-2.73MPH
Entry Speed
1
ST
30.54MPH
Median
Bobbi With An I
METRIC
RANK
DATA
Jump Index
10
TH
6.3/10
LGJ
4
TH
4.28L
FSP
4
TH
95.02%
Top Speed
5
TH
34.91MPH
Speed Lost
11
TH
-2.99MPH
Entry Speed
2
ND
30.28MPH
Median
Shantwopointfive
METRIC
RANK
DATA
Jump Index
12
TH
6.1/10
LGJ
9
TH
-2.96L
FSP
5
TH
89.4%
Top Speed
8
TH
34.65MPH
Speed Lost
12
TH
-3.08MPH
Entry Speed
6
TH
29.52MPH
Median
Spit Spot
METRIC
RANK
DATA
Jump Index
4
TH
6.7/10
LGJ
5
TH
1.5L
FSP
7
TH
89.31%
Top Speed
4
TH
34.98MPH
Speed Lost
5
TH
-2.48MPH
Entry Speed
5
TH
29.63MPH
Median
Moviddy
METRIC
RANK
DATA
Jump Index
7
TH
6.4/10
LGJ
6
TH
0.91L
FSP
6
TH
89.31%
Top Speed
1
ST
35.33MPH
Speed Lost
4
TH
-2.47MPH
Entry Speed
7
TH
29.39MPH
Median
Gaye Legacy
METRIC
RANK
DATA
Jump Index
5
TH
6.5/10
LGJ
8
TH
-1.87L
FSP
9
TH
89.02%
Top Speed
7
TH
34.66MPH
Speed Lost
6
TH
-2.59MPH
Entry Speed
9
TH
29.26MPH
Median
Notnowlinda
METRIC
RANK
DATA
Jump Index
9
TH
6.3/10
LGJ
10
TH
-3.13L
FSP
8
TH
89.17%
Top Speed
9
TH
34.45MPH
Speed Lost
9
TH
-2.74MPH
Entry Speed
8
TH
29.34MPH
Median
Mermaids Cave
METRIC
RANK
DATA
Jump Index
1
ST
7.4/10
LGJ
7
TH
-0.77L
FSP
10
TH
85.17%
Top Speed
11
TH
34.23MPH
Speed Lost
1
ST
-1.86MPH
Entry Speed
10
TH
28.84MPH
Median
Presenting Doy
METRIC
RANK
DATA
Jump Index
11
TH
6.2/10
LGJ
11
TH
-6.09L
Top Speed
2
ND
35.17MPH
Speed Lost
10
TH
-2.95MPH
Entry Speed
11
TH
28.81MPH
Median
Good Look Charm
METRIC
RANK
DATA
Jump Index
8
TH
6.4/10
LGJ
12
TH
-8.86L
Top Speed
6
TH
34.69MPH
Speed Lost
7
TH
-2.65MPH
Entry Speed
12
TH
28.35MPH
Median
Sectionals tutorial
Timing Data
Pos.
Horse Information
1st
3
(0)
Rockola Vogue
2nd
1 3/4 l
10
(0)
Star Walking
3rd
3 l
4
(0)
Porter In The Park
4th
7 1/2 l
12
(0)
Bobbi With An I
5th
19 l
1
(0)
Shantwopointfive
6th
1 1/4 l
8
(0)
Spit Spot
7th
1 3/4 l
11
(0)
Moviddy
8th
1 3/4 l
6
(0)
Gaye Legacy
9th
1/2 l
7
(0)
Notnowlinda
10th
18 l
2
(0)
Mermaids Cave
P
9
(0)
Presenting Doy
P
5
(0)
Good Look Charm
1f
2f
3f
4f
5f
6f
7f
8f
9f
10f
11f
12f
13f
14f
15f
16f
17f
18f
19f
20f
21f
22f
23f
24f
Total Time
7.57
6th | +0.86
14.20
9th | +1.50
14.06
9th | +1.70
14.85
8th | +1.79
15.28
9th | +1.87
15.48
8th | +1.66
15.49
9th | +1.59
15.30
8th | +1.43
15.57
9th | +1.38
15.71
9th | +1.53
14.90
9th | +1.22
15.66
8th | +1.28
15.03
10th | +1.50
13.55
10th | +1.23
13.83
10th | +1.32
13.64
8th | +1.17
14.39
8th | +1.12
14.70
8th | +1.12
15.12
6th | +0.68
15.18
7th | +0.54
15.00
5th | +0.31
14.53
1st | +0.00
14.58
1st | +0.00
14.95
1st | +0.00
5min, 48.57s
FSP: 98.87%
51015202520406080100
7.76
8th | +1.05
13.98
8th | +1.47
13.95
8th | +1.56
14.81
7th | +1.61
15.36
7th | +1.77
15.65
10th | +1.73
15.36
8th | +1.53
15.27
7th | +1.34
15.43
7th | +1.15
15.58
7th | +1.17
15.07
7th | +1.03
15.57
7th | +1.00
14.97
7th | +1.16
13.69
7th | +1.03
13.82
7th | +1.11
13.58
7th | +0.90
14.49
7th | +0.95
14.63
7th | +0.88
15.50
8th | +0.82
15.16
8th | +0.66
15.13
6th | +0.56
14.55
3rd | +0.27
14.45
2nd | +0.14
15.22
2nd | +0.41
5min, 48.98s
FSP: 98.5%
51015202520406080100
7.25
5th | +0.54
13.59
4th | +0.57
13.84
3rd | +0.55
14.75
5th | +0.54
15.26
5th | +0.60
15.49
4th | +0.40
15.61
3rd | +0.45
15.65
4th | +0.64
15.38
4th | +0.40
15.56
4th | +0.40
15.15
4th | +0.34
15.58
3rd | +0.32
14.88
5th | +0.39
13.80
4th | +0.37
13.89
4th | +0.52
13.64
5th | +0.37
14.50
5th | +0.43
14.81
5th | +0.54
15.43
5th | +0.41
15.04
2nd | +0.13
15.22
2nd | +0.12
14.81
2nd | +0.09
14.98
3rd | +0.49
15.52
3rd | +1.06
5min, 49.63s
FSP: 96.76%
51015202520406080100
7.04
2nd | +0.33
13.59
2nd | +0.36
13.65
2nd | +0.15
14.98
3rd | +0.37
15.14
2nd | +0.31
15.57
2nd | +0.19
15.62
2nd | +0.25
15.51
2nd | +0.30
15.54
3rd | +0.22
15.58
3rd | +0.24
15.08
2nd | +0.11
15.88
4th | +0.39
14.59
2nd | +0.17
13.82
3rd | +0.17
13.74
2nd | +0.17
13.91
4th | +0.29
14.35
3rd | +0.20
14.96
4th | +0.46
15.35
3rd | +0.25
15.50
4th | +0.43
15.02
4th | +0.22
14.91
4th | +0.29
15.97
4th | +1.68
16.04
4th | +2.77
5min, 51.34s
FSP: 95.02%
51015202520406080100
7.20
3rd | +0.49
13.82
5th | +0.75
13.73
5th | +0.62
14.66
4th | +0.52
15.18
4th | +0.50
15.63
5th | +0.44
15.83
5th | +0.71
15.55
5th | +0.80
15.44
5th | +0.62
15.74
5th | +0.80
15.00
5th | +0.59
15.50
5th | +0.49
14.69
4th | +0.37
13.88
5th | +0.43
13.86
5th | +0.55
13.47
3rd | +0.23
14.40
2nd | +0.19
14.66
2nd | +0.15
15.41
1st | +0.00
15.32
1st | +0.00
15.41
3rd | +0.18
15.48
6th | +0.82
17.77
5th | +4.01
17.98
5th | +7.04
5min, 55.61s
FSP: 89.4%
51015202520406080100
6.71
1st | +0.00
13.56
1st | +0.00
13.86
1st | +0.00
14.76
1st | +0.00
15.20
1st | +0.00
15.69
1st | +0.00
15.56
1st | +0.00
15.46
1st | +0.00
15.62
1st | +0.00
15.56
1st | +0.00
15.21
1st | +0.00
15.60
1st | +0.00
14.81
1st | +0.00
13.82
1st | +0.00
13.74
1st | +0.00
13.79
1st | +0.00
14.44
1st | +0.00
14.70
1st | +0.00
15.73
2nd | +0.17
15.32
3rd | +0.17
15.06
1st | +0.00
15.56
5th | +0.72
18.38
6th | +4.52
17.76
6th | +7.33
5min, 55.9s
FSP: 89.31%
51015202520406080100
7.20
3rd | +0.49
13.62
3rd | +0.55
13.88
4th | +0.57
14.53
2nd | +0.34
15.18
3rd | +0.32
15.60
3rd | +0.23
15.80
4th | +0.47
15.36
3rd | +0.37
15.32
2nd | +0.07
15.69
2nd | +0.20
15.21
3rd | +0.20
15.62
2nd | +0.22
14.78
3rd | +0.19
13.77
2nd | +0.14
13.92
3rd | +0.32
13.63
2nd | +0.16
14.50
4th | +0.22
14.78
3rd | +0.30
15.56
4th | +0.30
15.45
4th | +0.43
15.59
9th | +0.79
16.52
10th | +2.47
17.83
8th | +5.72
16.88
7th | +7.65
5min, 56.22s
FSP: 89.31%
51015202520406080100
7.82
9th | +1.11
13.79
6th | +1.34
13.75
6th | +1.23
14.75
6th | +1.22
15.27
6th | +1.29
15.56
6th | +1.16
15.52
6th | +1.12
15.48
6th | +1.14
15.47
6th | +0.99
15.73
6th | +1.16
15.01
6th | +0.96
15.61
6th | +0.97
14.89
6th | +1.05
13.66
6th | +0.89
13.75
6th | +0.90
13.71
6th | +0.82
14.35
6th | +0.73
14.79
6th | +0.82
15.42
6th | +0.68
15.16
6th | +0.52
15.38
7th | +0.67
15.83
7th | +1.66
18.50
7th | +5.58
17.40
8th | +8.03
5min, 56.6s
FSP: 89.02%
51015202520406080100
7.95
10th | +1.24
14.13
10th | +1.81
13.81
10th | +1.76
14.79
8th | +1.79
15.22
8th | +1.81
15.40
7th | +1.52
15.43
7th | +1.39
15.54
9th | +1.47
15.38
8th | +1.23
15.68
8th | +1.35
14.93
8th | +1.07
15.82
9th | +1.29
14.76
8th | +1.24
13.68
9th | +1.10
13.87
8th | +1.23
13.75
9th | +1.19
14.42
10th | +1.17
14.86
9th | +1.33
15.30
10th | +1.07
14.99
9th | +0.74
15.34
10th | +0.85
16.05
9th | +2.06
18.58
9th | +6.06
17.05
9th | +8.16
5min, 56.73s
FSP: 89.17%
51015202520406080100
7.62
7th | +0.91
14.12
7th | +1.47
13.88
7th | +1.49
15.30
10th | +2.03
15.23
10th | +2.06
15.29
8th | +1.66
15.53
10th | +1.63
15.34
10th | +1.51
15.55
10th | +1.44
15.69
10th | +1.57
14.88
10th | +1.24
16.06
10th | +1.70
14.36
9th | +1.25
13.64
8th | +1.07
13.91
9th | +1.24
14.11
10th | +1.56
14.02
9th | +1.14
15.28
10th | +1.72
14.75
9th | +0.91
15.26
10th | +0.85
15.08
8th | +0.70
16.18
8th | +2.04
19.79
10th | +7.25
19.91
10th | +12.21
6min, 0.78s
FSP: 85.17%
51015202520406080100
N/A
5101520250.000000000050.000000000100.000000000150.00000000020
N/A
5101520250.000000000050.000000000100.000000000150.00000000020
Times accurate to +/-0.2s or more excluding the location accuracy (+/-0.5m, approximately 0.03s). One horse length is run in approximately 0.2s on good or firmer ground, 0.22s on good ground, and 0.25s on soft or slower ground.
Copyright 2025 Racing TV - All Rights Reserved.
My Account
Home
Watch
Live
Replays
On Demand
Catch Up
Tv Schedule
RTV Play Schedule
Racecards
Racecards
Today's Runners
Non-Runners
Tommorow's Runners
Racing Calendar
Results
Tips
Racing TV Tipsters
Nap Of The Day
News
All
Latest
Highlights
Columnists
Most Viewed
Free Bets
Members
Benefits
Join
RtvExtra
Club Days
Syndicate
Magazine
Rewards4Racing
Tracker
More
Racecourses
Profiles
Podcasts
Packages
Competitions
Racecourse Offers
Racing TV Syndicate
Casino Offers & Free Spins
RaceiQ
Responsible Gambling
TV Authentication
Betting Guides
Cheltenham Free Bets
Best Betting Sites UK
Patch Time
DeviceID
Version
production-
Races
Tips
Watch
Results
Menu
RaceiQ Race Metrics
RaceiQ results data is now available for all British and Irish races. “Performance Bars” show how a horse fared against the field in each Race Metric, with a full bar indicating best-in-race, an empty bar indicating worst, whilst the black line shows the median.
Find Out More
1 of 6
Next